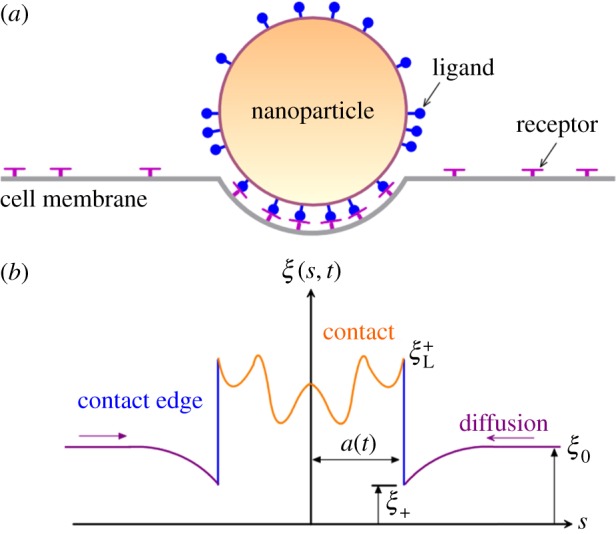
Figure 1.

Schematic diagram of cellular uptake of NPs with different ligand distributions. (a) Remote mobile receptors diffusing to binding sites to drive cellular uptake. (b) Receptor density distribution along cell membrane. At the contact region, the receptor density is not constant.
