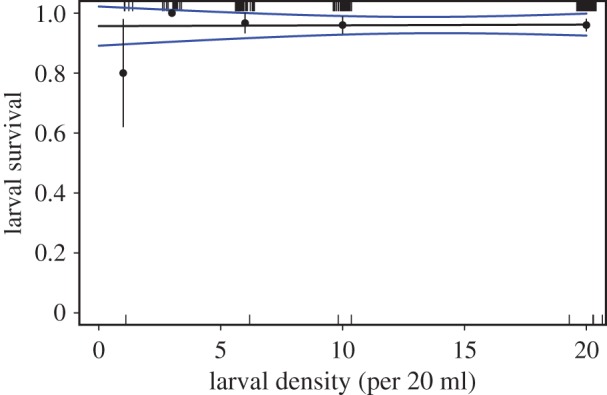
Figure 1.

Relationship between larval density and proportional survival of A. millepora coral larvae 226 h following spawning. Experiment began 60 h following spawning. The black solid line represents the mean model fit, blue lines represent the s.e.m. of the model fit, black circles and vertical bars represent the mean and s.e.m. among tanks, and the small notches (top and bottom x-axes) represent individual data points. There were five replicate tanks per larval density.
