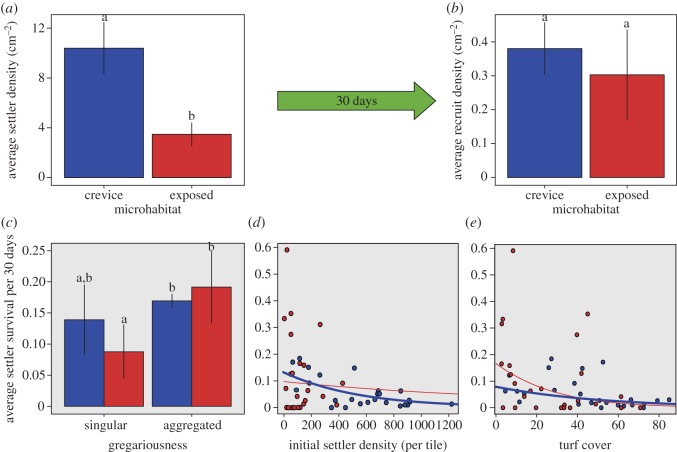
Figure 3.
Average A. millepora densities (cm−2) among crevice (blue) and exposed (red) microhabitats at (a) settlement and (b) following 30 days in field experiments. Explanatory variables of post-settlement survival are displayed in grey panels and include the effects of (c) gregariousness, (d) initial settler density and (e) turf cover. Bars with different letters above them in a, b and c are significantly different, and solid lines in d and e represent the mean prediction of significant (thick and blue) and non-significant (thin and red) model fits. There were five replicate sites with five replicate tiles per microhabitat. Note the different scales for y-axes.

