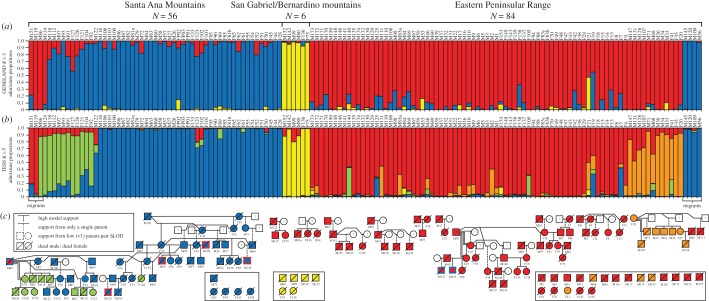
Figure 2.
Population assignments (a,b) and pedigree analyses (c) of pumas (N = 146) in the Los Angeles–San Diego region of California. Program GENELAND (a) identified three populations including the Santa Ana (blue), San Gabriel/Bernardino (yellow) and Eastern Peninsular Range (red) mountains. Program TESS (b) identified additional substructure within the Santa Ana population (green) and within the Eastern Peninsular Range (orange). Pumas were numbered in the order they were captured and M or F refers to whether that individual was a male or female, respectively (upper x-axis). Migrants from the Eastern Peninsular Range to the Santa Ana Mountains (N = 3) are indicated on the left; migrants from the Santa Ana Mountains to the Eastern Peninsular Range (N = 4) are indicated on the right. Familial relationships (c) were estimated using the pedigree-reconstruction program CERVUS, and confirmed with program COLONY. Within the pedigree, individual squares (males) and circles (females) are filled based on maximum admixture proportion in TESS (b). Coloured borders indicate the location where immigrant pumas were sampled. Individuals with unknown lineages (i.e. singletons) are pooled in open boxes. Instances of inbreeding are indicated with double lines.

