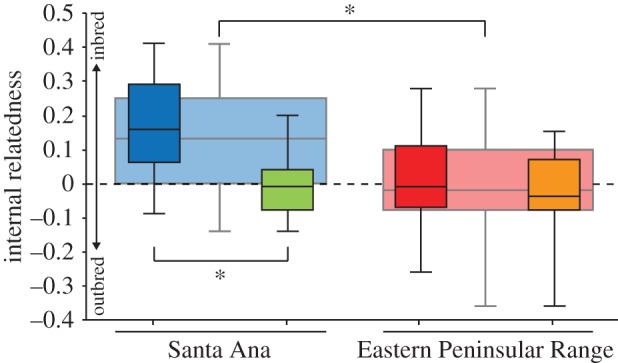
Figure 3.

Internal relatedness (i.e. relative outbred–inbred continuum) of Santa Ana and Eastern Peninsular Range pumas. Wide background boxplots represent populations identified in GENELAND (figure 2a). Colours of foreground boxes correspond to TESS subpopulations (figure 2b). Green corresponds to M86 and his offspring. Orange primarily corresponds to F20 and her offspring. Min, max, inter-quartiles and median are presented.
