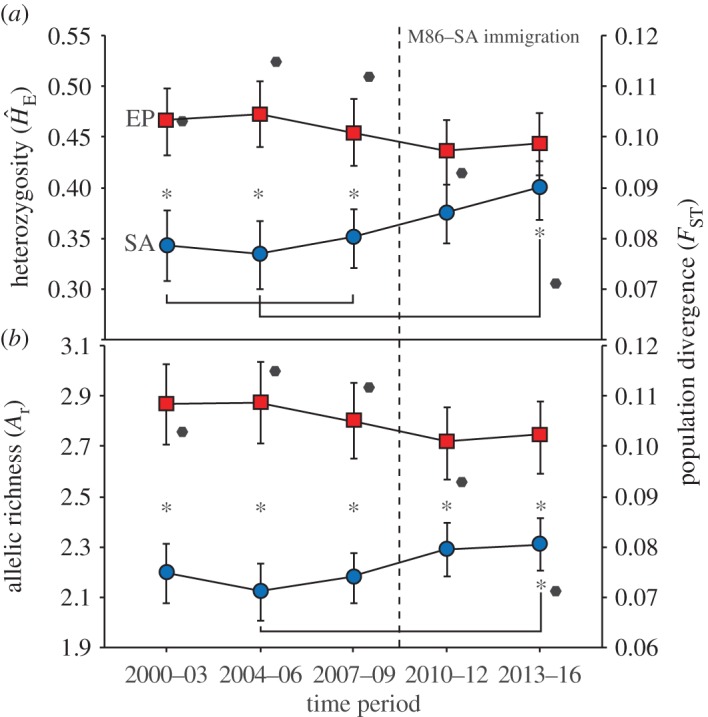
Figure 4.

Temporal patterns of (a) unbiased expected heterozygosity, (b) allelic richness, and population divergence (FST: black hexagons; right y-axis) for the Eastern Peninsular Range (EP) and Santa Ana (SA) puma populations before (left of vertical dashed line) and after (right of the vertical dashed line) the migration of M86 into SA from EP. Unbiased expected heterozygosity is a robust genetic diversity estimator for small sample sizes; allelic richness was sample-size corrected. All pairwise FST estimates were significantly different from zero. Squares/circles are offset from hexagons for easier visualization. Pumas estimated to be alive at any point within time periods were included in time period estimates. Means and s.e.s are presented. Sample sizes include 27 (number of males & females: 13 & 14, respectively), 25 (11 & 14), 26 (16 & 10), 28 (22 & 6), and 33 (26 & 7) for EP; 10 (1 & 9), 9 (5 & 4), 29 (16 & 13), 38 (21 & 17) and 24 (13 & 11) for SA.
