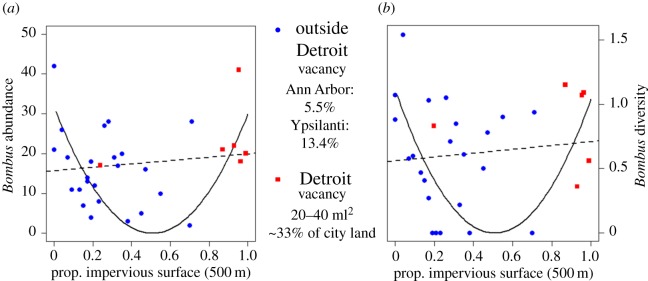
Figure 1.
Scatterplots of (a) overall Bombus abundance and (b) overall Bombus diversity with impervious surface measured in the 500 m radii from sites. Sites outside the city limits of Detroit are shown in blue circles and sites within the city limits of Detroit are shown in red squares. (a) Initial linear analysis shows no significant interactions between Bombus abundance and % impervious space (general linear model, dashed line, F1,28 = 0.513, p = 0.48, R2 = −0.0171). However, a parabolic model can be significantly fitted to the data (solid line), ; y is the overall Bombus abundance, x the proportion of impervious surface proportion at 500 m, a = 11.09 with p < 0.001, i = 5.632 with p < 0.001. Residual standard error: 11.08 on 28 d.f. (b) Initial linear analysis shows no significant interactions between Bombus diversity and % impervious space (e.g. general linear model, dashed line, F1,28 = 0.341, p = 0.564, R2 = −0.0233). However, a parabolic model can be significantly fitted to the data (solid line), ; y is the overall Bombus diversity, x the proportion of impervious space at 500 m, a = 2.08 with p < 0.001, i = 1.056 with p < 0.001. Residual standard error: 0.474 on 28 d.f.

