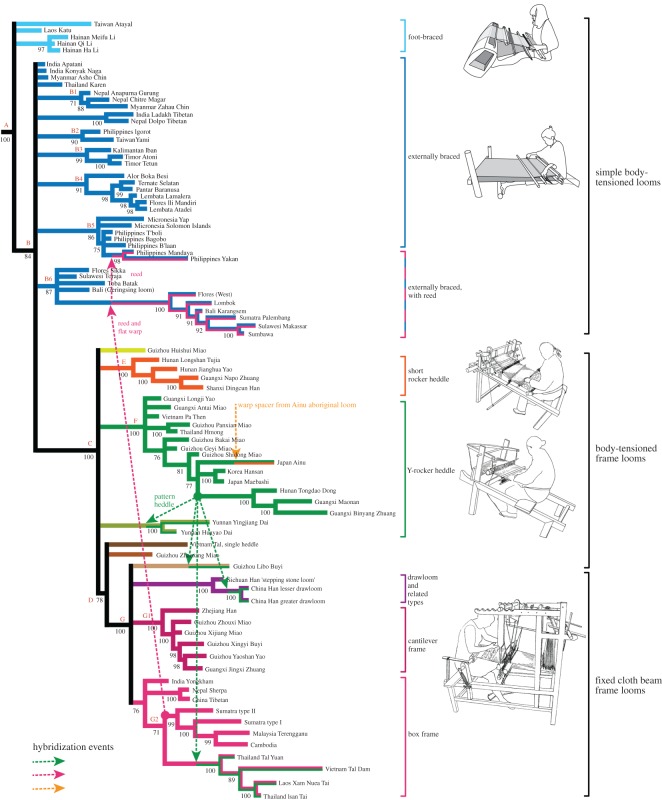
Figure 5.
70% consensus tree, summarizing the results of the Bayesian phylogenetic analysis of the looms survey data. Colours and brackets indicate the main clades. Examples of actual looms are shown on the right to illustrate the structural features of the clades. Hybridization events (horizontal exchange of technologies) are shown by dotted lines linking lineages. Percentages of trees that contributed to each node are shown beside the nodes. Branch lengths indicate the approximate number of character changes in each lineage (not time depths).

