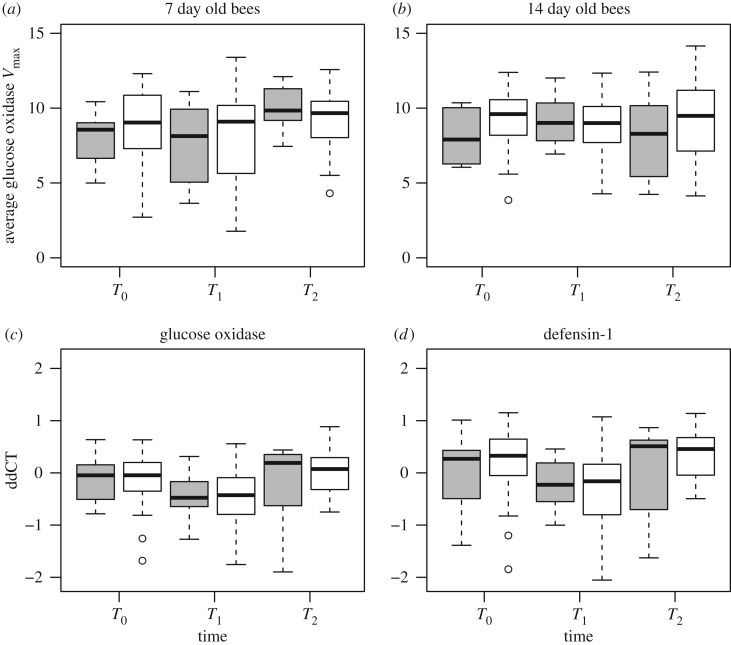
Figure 2.
Levels of GOX enzymatic activity (a,b), and relative transcript abundances for GOX (c) and Def1 (d) represented in boxplots. Each box represents the median (middle horizontal line), first and third quartile (upper and bottom horizontal lines, respectively), and the vertical lines extend to the maximum and minimums of the data, with the circles outside of these boundaries indicating outliers. Grey and white boxplots depict control and AFB treatment colonies, respectively.

