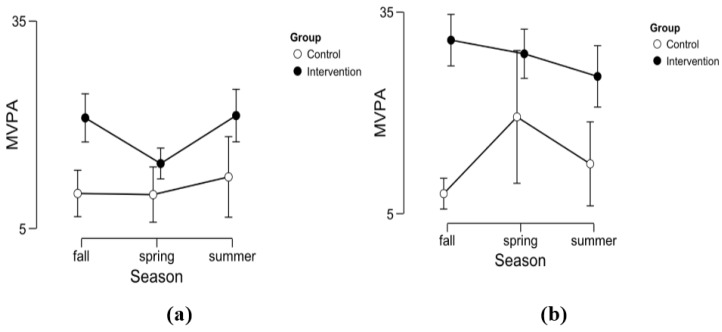
Figure 1.
Here, the different moderate-to-vigorous physical activity (MVPA) levels are displayed for (a) the accumulated values from 8:30 AM to 10:30 AM, and (b), the accumulated values from 10:30 AM to 12:30 PM with respect to seasons and group. The descriptive parameters can be seen in Table 3. The error bars indicate the 95% confidence interval (CI). Inferential analyses reveal that intervention group (IG) are estimated 11:30 min longer in MVPA levels (SE = 2.08) than the control group (CG) (p < 0.001) per 2-h time interval (cf. Table A3 in the Appendix). The difference is especially bigger in the second half of the school day (p < 0.001).

