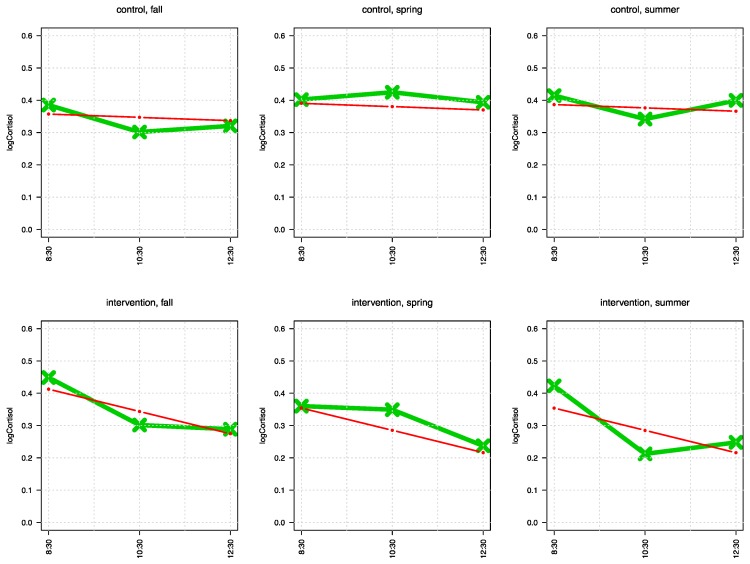
Figure 2.
Displayed are the running curves of logCortisol over the day in each season for both groups. The upper panels show the CG values, the lower panels IG values. The green line represents the mean values, the red line connects the calculated values of least squares regression. It can be seen that IG shows, in contrast to CG, a clear decrease of cortisol levels in the course of the school days, but not the CG (p = 0.009).

