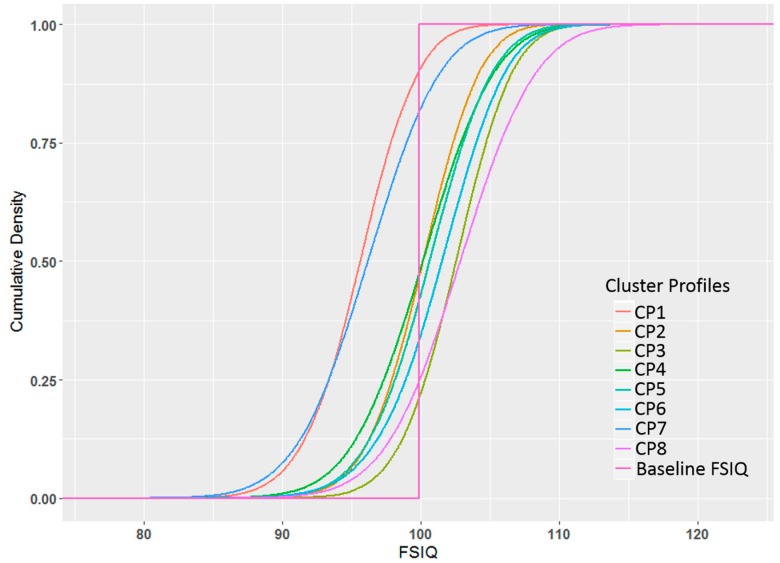
Figure 3.
Cumulative probability density plots of cluster-specific posterior adjusted FSIQ distribution (compared to baseline FSIQ). Baseline FSIQ was determined by computing an unweighted overall average FSIQ across all clusters at each iteration (mean = 99.8), however, when calculating a weighted overall average FSIQ (weighted by cluster sizes), the difference between Baseline FISQ and weighted Baseline FSIQ is marginal (<0.5).

