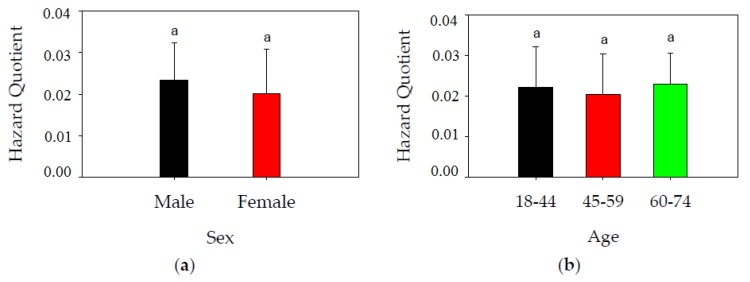
Figure 4.
(a) Estimated risks (mean ± standard deviation) of Hg exposure in rice with respect to the sex of consumers; (b) Estimated risks (mean ± standard deviation) of Hg exposure in rice with respect to age of consumers. Data of both male and female responses combined. Letter a in the figure indicate significant difference (p < 0.05).

