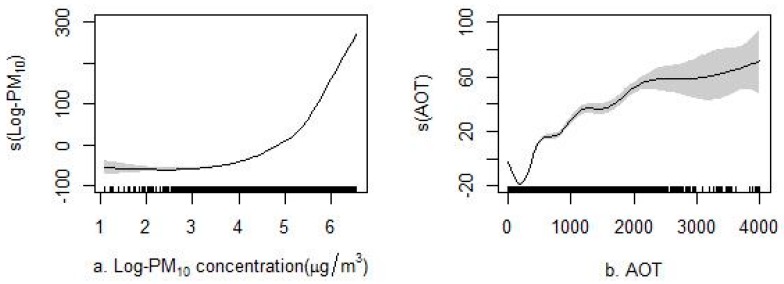
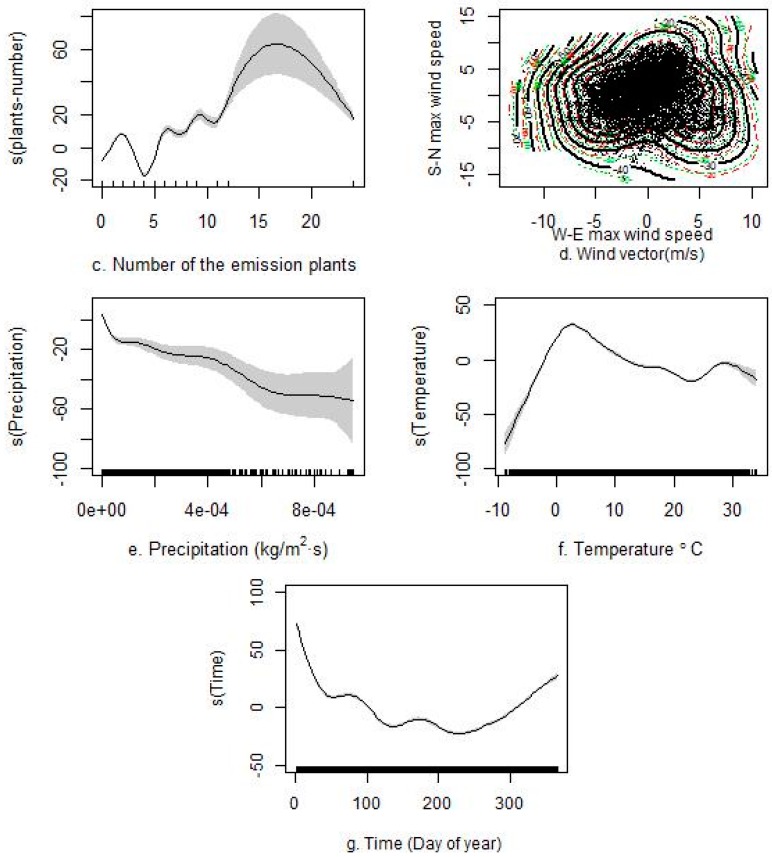
Figure 5.
The non-linear associations between each predictor and PM2.5. The non-linear association between (a) Log-PM10 and PM2.5; (b) aerosol optical thickness (AOT) and PM2.5; (c) number of the emission plants and PM2.5; (d) wind and PM2.5; (e) precipitation and PM2.5; (f) temperature and PM2.5; (g) day of year and PM2.5.


