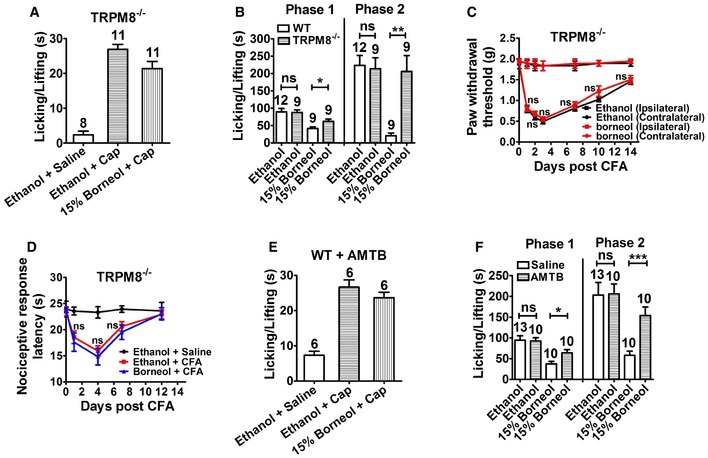
Figure 5. The effect of topical borneol in TRPM8−/− mice and WT mice with pharmacologically inhibited TRPM8.

- Quantification of the borneol effect on capsaicin (Cap)‐induced nociceptive responses in TRPM8−/− mice. The experimental procedure was the same as that in Fig 2A.
- Quantification of the borneol effect on formalin‐induced biphasic pain responses in TRPM8−/− mice. The experimental procedure was the same as that in Fig 2C.
- Quantification of the borneol effect on CFA‐induced mechanical hyperalgesia in TRPM8−/− mice. The experimental procedure was the same as that in Fig 2D. The statistical analysis was performed between the groups of Borneol (Ipsilateral) and Ethanol (Ipsilateral). n = 8 mice for each group.
- Quantification of the borneol effect on CFA‐induced thermal hyperalgesia in TRPM8−/− mice. The experimental procedure was the same as that in Fig 2E. The statistical analysis was performed between the groups of Borneol + CFA (n = 12) and Ethanol + CFA (n = 10). n = 8 for the group of Ethanol + Saline.
- Quantification of the borneol effect on Cap‐induced nociceptive responses in WT mice with TRPM8 being inhibited pharmacologically. TRPM8 antagonist AMTB was injected into a hindpaw 15 min before borneol application. Subsequent experimental procedure was the same as that in Fig 2A.
- Quantification of the borneol effect on formalin‐induced biphasic pain responses in WT mice with or without TRPM8 being inhibited pharmacologically. Saline or AMTB was injected into a hindpaw 15 min before borneol application. 15% borneol was applied to the paw for a total of three times, and 1.5% formalin was injected into the paw after 10 min. Paw licking and lifting time in both phases was measured. Saline was used as a control to AMTB and ethanol was used as a control to borneol.
