
Figure 2. PRDM16 blocks type I IFN signaling downstream of IFNAR receptor.
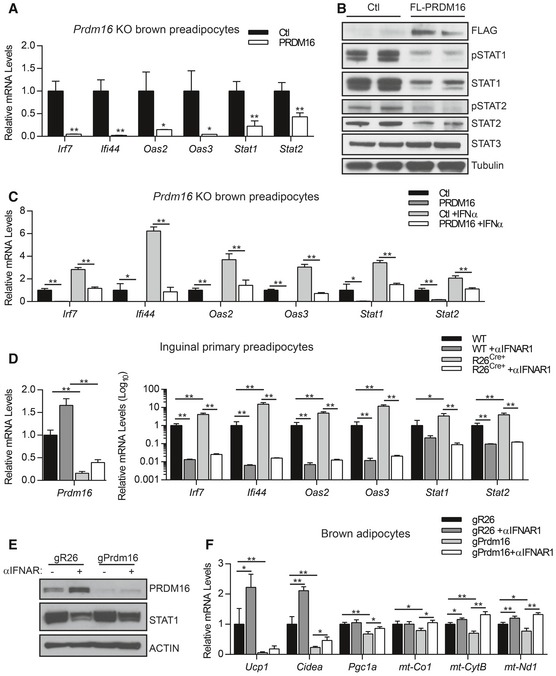
- Relative mRNA levels of IFN‐stimulated genes (ISGs) in Prdm16 KO brown adipocyte precursors infected with control (Ctl) or PRDM16 retrovirus. Data represent (n = 3) mean ± standard deviation and are consistent with results from duplicate independent experiments. *P ≤ 0.05, **P ≤ 0.01 (Student's t‐test).
- Western blot analysis of FLAG, phosphorylated STAT1 (pSTAT1), STAT1, phosphorylated STAT2 (pSTAT2), STAT3, and tubulin (loading control) protein in Prdm16 KO precursors infected with control (Ctl) or FLAG‐PRDM16 retrovirus.
- Relative mRNA levels of ISGs in control (Ctl) and PRDM16‐expressing preadipocytes +/− recombinant mouse IFNα. Data represent (n = 3) mean ± standard deviation and are consistent with results from duplicate independent experiments. *P ≤ 0.05, **P ≤ 0.01 (Student's t‐test).
- Relative mRNA levels of ISGs in WT and R26Cre+ inguinal preadipocytes treated with 4OHT and vehicle or anti‐IFNAR1 neutralizing antibody (αIFNAR1) for 4 days. Data represent (n = 3) mean ± standard deviation and are consistent with results from duplicate independent experiments. *P ≤ 0.05, **P ≤ 0.01 (paired two‐way ANOVA).
- Western blot analysis of PRDM16, STAT1, and actin (loading control) protein in brown adipocytes expressing gR26 (control) and gPrdm16 CRISPR/Cas9 constructs and treated +/− αIFNAR1 throughout differentiation.
- Relative mRNA levels of brown‐selective (Ucp1, Cidea, Pgc1a) and mitochondrial (mt‐Co1, mt‐CytB, mt‐Nd1) genes in brown adipocytes expressing gR26 and gPrdm16 CRISPR/Cas9 constructs +/− αIFNAR1 throughout differentiation. Data represent (n = 3) mean ± standard deviation and are consistent with results from duplicate independent experiments. *P ≤ 0.05, **P ≤ 0.01 (paired two‐way ANOVA).
Source data are available online for this figure.