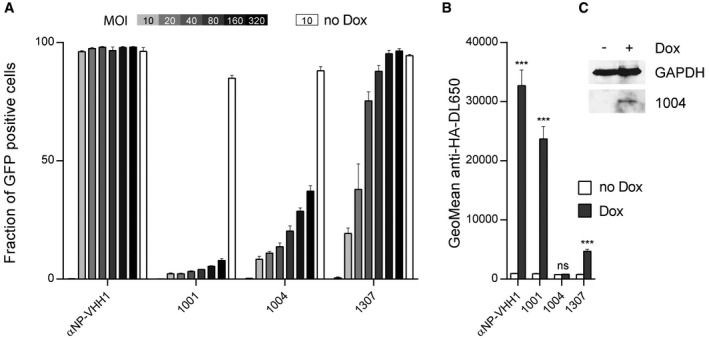
Figure 1. Inhibitory properties of VSV N‐specific VHHs.

- VSV N‐specific VHHs differentially cope with increasing doses of VSV. A549 cells expressing VHHs in a doxycycline (Dox)‐inducible manner were seeded 24 h before VSV infection. VHH expression was induced (gray to black bars) with Dox, or cells were left untreated (white bars). Each cell line was infected with increasing amounts of VSV‐GFP (MOI = 0–320). Cells were harvested 4 h post‐infection, and the percentage of infected cells (GFP positive) was quantified by flow cytometry. Average data from three independent experiments (± s.e.m.; n = 3) are shown.
- Quantification of VHH expression levels in A549 cells. Cells were seeded, and HA‐tagged VHH expression was induced with Dox. After 24 h, cells were harvested and stained for VHH‐HA using anti‐HA‐DL650 antibodies. The geometric mean of anti‐HA‐DL650 fluorescence was quantified by flow cytometry and compared to uninduced cells lines. Average data from three independent experiments (± s.e.m.) are shown (n = 3; t‐test; ***P < 0.001; ns = non‐significant). Exact P‐values are shown in Table EV1.
- Lysates of A549 cell lines inducibly expressing VHH 1004 were subjected to immunoblot analysis using GAPDH and HA‐tag (VHH‐HA) antibodies.
