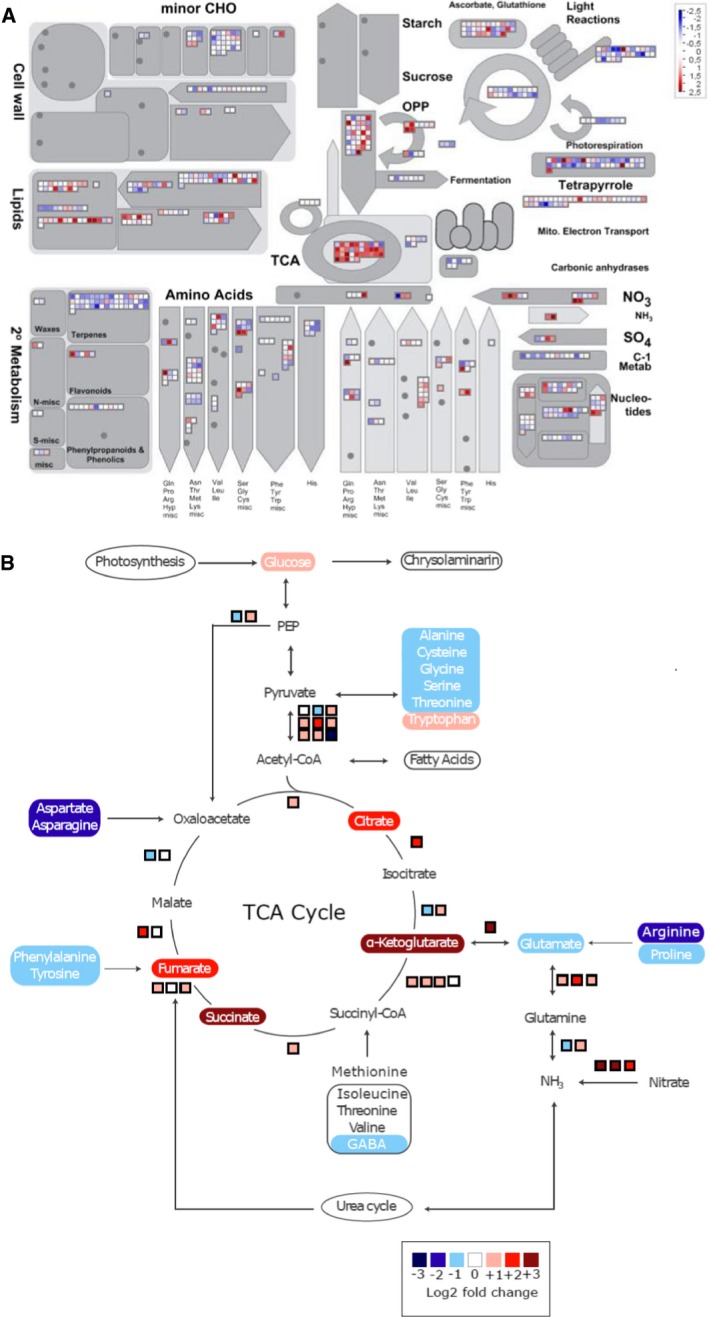
Overview of amino acid degradation and central carbon metabolism (adapted from Hockin
et al,
2012 and Obata
et al,
2013). Not all reaction products are shown, and some arrows represent more than one reaction. Measured metabolites are indicated by rectangles of which the colours indicate relative log
2 fold change in nitrogen‐starved versus control cells at 20 h. Pathways are indicated by ovals. Coloured boxes next to arrows indicate mRNA expression changes in log
2 fold change of FPKM values of the nitrogen‐starved sample versus the control sample at 20 h.