
Figure 2. Nitrogen starvation alters carbon reallocation.
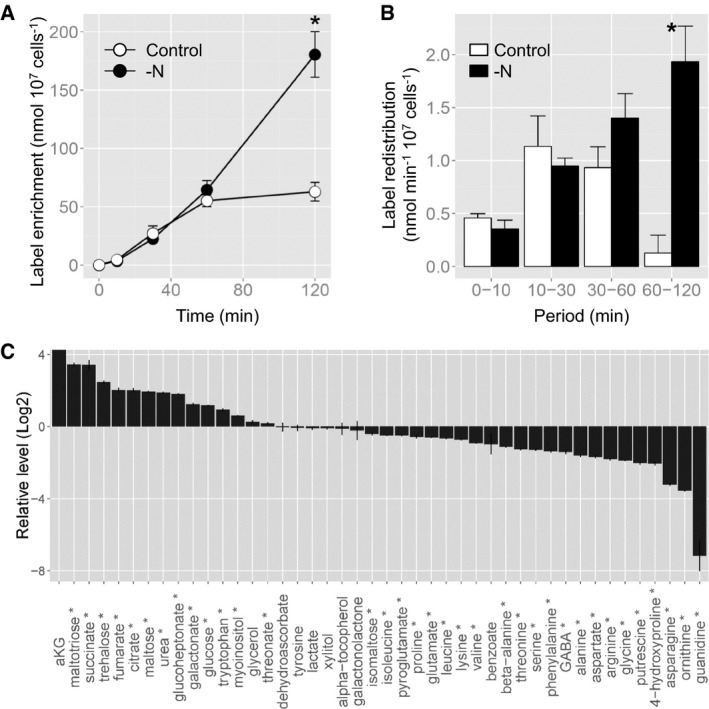
13C label accumulation in citrate following 13C‐acetate feeding to nitrogen‐depleted cells. Cells grown for 20 h on control (Control, white) or nitrogen‐depleted (‐N, black) regimes were fed with 13C‐acetate, and 13C label accumulation in citrate was analysed. All values represent the mean ± SE of six biological replicates.
- Time course of 13C enrichment in citrate. The asterisk indicates the time period at which the values are significantly different between nitrogen‐depleted and control cells by a Student's t‐test (P < 0.05).
- Label redistribution in citrate during the periods of 0–10, 10–30, 30–60, and 60–120 min. The asterisk indicates the time period at which the values are significantly different between nitrogen‐depleted and control cells by a Student's t‐test (P < 0.05).
- The log2 fold changes in metabolite levels in nitrogen‐starved versus control cells following 20 h of culturing in nitrogen‐depleted conditions. The metabolites marked by an asterisk were significantly altered between control and nitrogen‐depleted conditions by a Student's t‐test (P < 0.05). α‐ketoglutarate (aKG) was detected only in nitrogen‐starved cells.