
Figure 6. Diurnal rhythms affect the TCA cycle and bZIP14 expression.
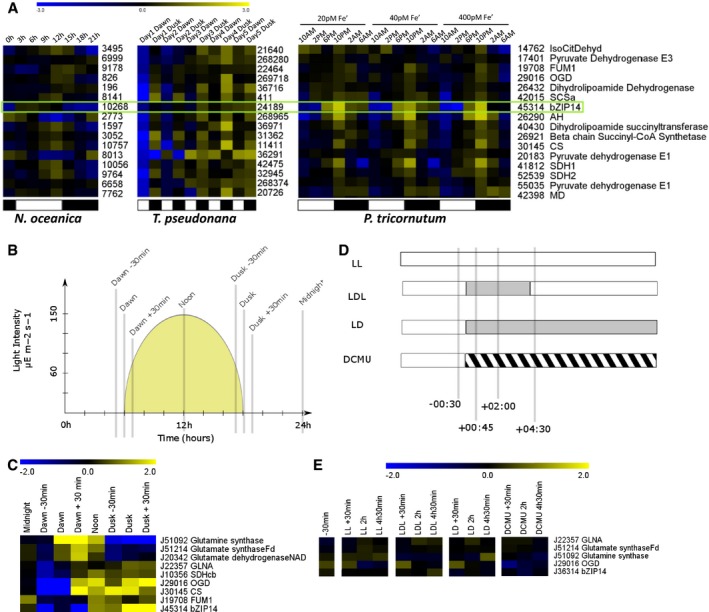
- Meta‐analysis of the expression patterns of bZIP14 orthologues in three different species of heterokonts, derived from independent transcriptomics datasets, that is, from left to right Nannochloropsis oceanica (Poliner et al, 2015), Thalassiosira pseudonana (Ashworth et al, 2013) and P. tricornutum (Smith et al, 2016). The numbers reflect CCMP1779, Thapsdraft3, and Phatr3 identifiers, respectively. FPKM values were log2 transformed and centred for comparison. Yellow and blue indicate gene induction and repression, respectively. The green box highlights the expression of bZIP14 orthologues, suggesting that its diurnal expression pattern is conserved. Representative genes from the TCA cycle were retrieved from the Smith et al (2016) dataset and clustered (Spearman's rank) after normalization. Orthologous genes in T. pseudonana and N. oceanica were identified by BLASTP, normalized, and ranked in the same order. Approximate light regimes are indicated below the clusters as light (white) and dark (black). Enzyme abbreviations are identical to those in Fig 3.
- Cartoon illustrating the growing conditions and sampling points (grey bars) of cells grown in a 12‐h:12‐h diurnal rhythm. The yellow surface indicates the light intensity (values indicated in the y‐axis).
- Heatmap of log2 transformed and centred transcript data for selected nitrogen assimilation and TCA cycle genes. Expression was determined by qRT–PCR (n = 3). Yellow and blue indicate gene induction and repression, respectively. Enzyme abbreviations are identical to those in Fig 3. GLNA, type III glutamine synthase.
- Treatments on continuously illuminated cells. Bars indicate sampling points relative to treatment start. Grey and hatched areas indicate dark and DCMU treatment, respectively. LL, continuous light; LDL, continuous light interrupted by a period of darkness; LD, continuous light followed by darkness; DCMU, DCMU‐treated cells in the light.
- Heatmap of log2 transformed and centred transcript data for selected nitrogen assimilation and TCA cycle genes. Expression was determined by qRT–PCR (n = 3). Yellow and blue indicate gene induction and repression, respectively.