-
A
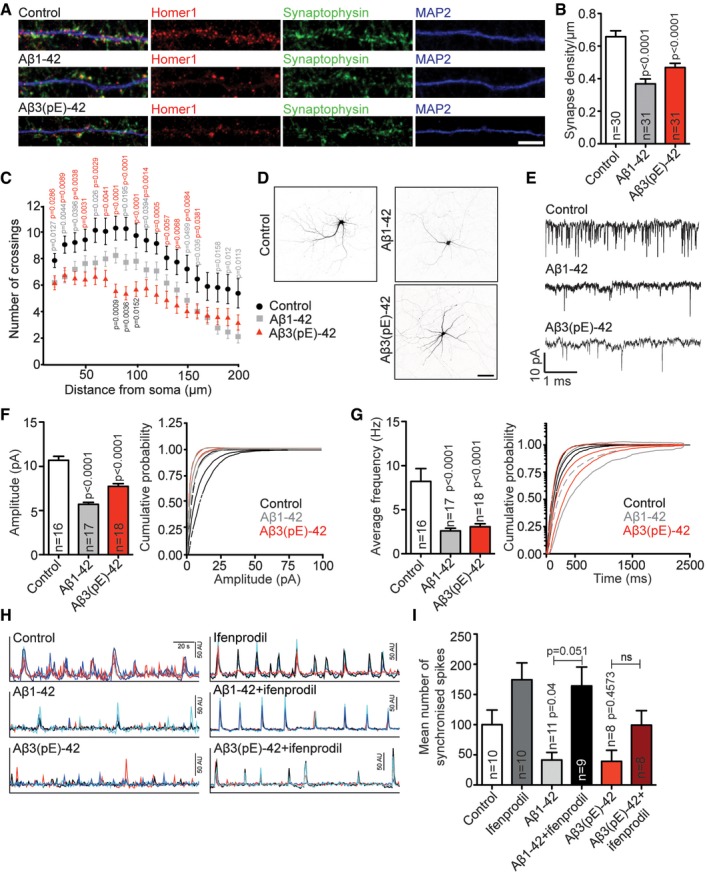
Both Aβ1‐42 and Aβ3(pE)‐42 cause synaptic loss. Representative confocal images of dendrites used for quantification. Scale bar, 5 μm.
-
B
Bar plot representing synaptic density of DIV20 neurons stained for Homer1, Synaptophysin and MAP2 after treatment with 500 nM Aβ1‐42 or Aβ3(pE)‐42 for 3 days compared to non‐treated controls. n corresponds to the number of separate dendritic segments on different neurons analysed from at least three independent coverslips and at least two independent cell cultures.
-
C
Both Aβ1‐42 and Aβ3(pE)‐42 cause simplification of the dendritic tree. The graph represents the results of a Sholl analysis of GFP‐transfected neurons treated with Aβ1‐42 (n = 23) or Aβ3(pE)‐42 (n = 25) and corresponding controls (n = 25). n corresponds to the number of neurons analysed from at least three independent coverslips and at least three independent cell cultures.
-
D
Images of representative neurons. Scale bar, 100 μm.
-
E
Aβ1‐42 and Aβ3(pE)‐42 cause a decrease in mEPSC amplitude and frequency. Example traces of mEPSCs in neurons treated with Aβ1‐42 and Aβ3(pE)‐42.
-
F, G
Cumulative probability plot and bar graph illustrating effects of Aβ1‐42 and Aβ3(pE)‐42 treatment on mean amplitude (F) or frequency of mEPSCs (G). n corresponds to the number of neurons analysed from at least four independent cell cultures.
-
H
Example traces from Ca2+ imaging. Four to six cells from the same scan are depicted with different colours.
-
I
Treatment for 3 days with Aβ1‐42 or Aβ3(pE)‐42 caused a decrease in the frequency of synchronised calcium waves. Co‐application of ifenprodil rescues the phenotype caused by Aβ1‐42 but not those of Aβ3(pE)‐42 application. n corresponds to the number of independent coverslips from at least four independent cell cultures.
Data information:
P‐values, unless indicated otherwise in the graph, refer to control by one‐way ANOVA. Data are represented as the mean ± s.e.m. For a Sholl analysis, two‐way ANOVA followed by an unpaired two‐tailed Student's
t‐test was used.
P‐values in red refer to Aβ3(pE)‐42 compared to control, in grey Aβ1‐42 compared to control and in black between oligomers within the same distance from soma.

