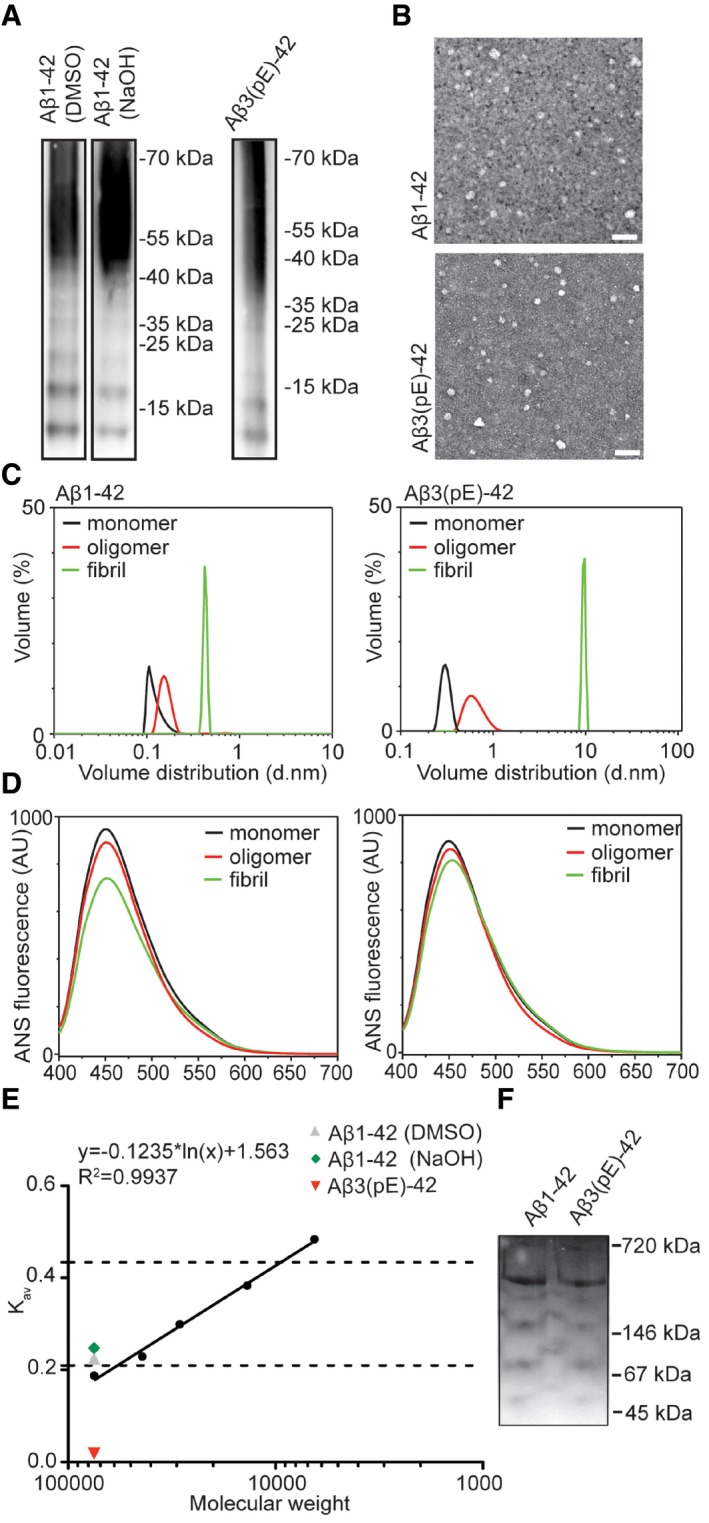
Figure EV1. Characterisation of oligomeric preparation.

- SDS–PAGE revealed a similar distribution of Aβ3(pE)‐42 and Aβ1‐42 species prepared with two different protocols with low (from 12 to 65 kDa) and higher molecular weight oligomers. The oligomerisation method does not significantly influence the distribution of Aβ1‐42.
- Images from TEM revealed globular but not fibrillar structures for both peptide preparation. Scale bar, 50 nm.
- Volume distribution of monomeric (black line), oligomeric (red line) and fibrillar (green line) preparations measured by dynamic light scattering shows distinct size distributions for all preparations.
- ANS spectroscopy measurements revealed different surface hydrophobicity for monomeric (black line), oligomeric (red line) and fibrillar (green line) preparations of both peptides.
- Graph representing gel filtration column calibration and the highest amount of eluted oligomers detected by an ELISA assay. Dashed lines indicate low‐n oligomer range (12–65 kDa).
- Image of native PAGE gel reveals that both preparations have similar migration pattern.
Source data are available online for this figure.
