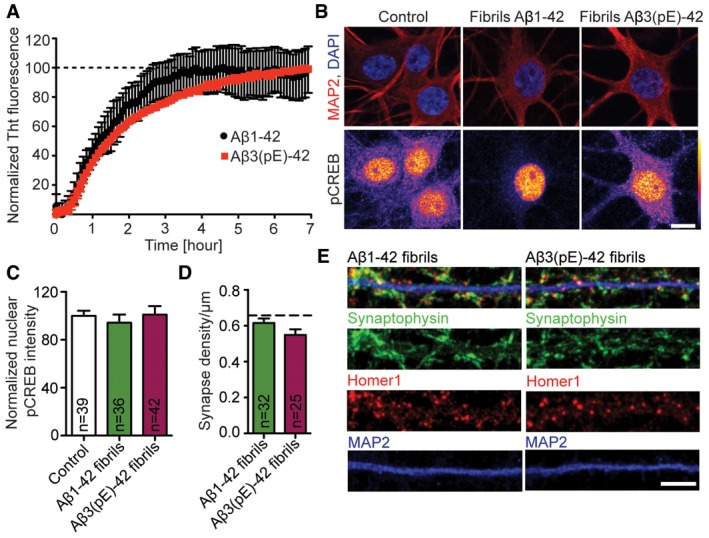
Figure EV2. Fibrilar forms of Aβ1‐42 or Aβ3(pE)‐42 do not cause significant synapse loss and CREB shut‐off.

-
AGraph showing fibrillisation kinetics of Aβ1‐42 (n = 3) and Aβ3(pE)‐42 (n = 2). The fluorescence increases over time until reaching a plateau (dashed line) indicating formation of stable fibrils used in further experiments.
-
B, CTreatment with Aβ1‐42 fibrils and Aβ3(pE)‐42 fibrils do not alter pCREB nuclear levels. (B) Confocal images averaged from two sections of the nucleus of DIV18, primary, hippocampal neurons stained for MAP2, DAPI and pCREB. Original pixel intensities from 0 to 255 are represented as a gradient lookup table. Scale bar, 10 μm. (C) Bar graph representing mean nuclear pCREB staining intensity. n corresponds to the number of nuclei from different neurons analysed from at least four independent coverslips and at least two independent cell cultures.
-
D, ENeither Aβ1‐42 nor Aβ3(pE)‐42 fibrils cause synaptic loss. (D) Bar plot representing synaptic density of DIV20 neurons stained for Synaptophysin, Homer1 and MAP2 after Aβ1‐42 and Aβ3(pE)‐42 treatment compared to not treated control, represented in Fig 1B. Dashed line indicates mean control synapse density from Fig 1B. n corresponds to the number of separate dendritic segments on different neurons analysed from at least three independent coverslips and at least two independent cell cultures. (E) Representative confocal images of dendrites used for quantification. Scale bar, 5 μm.
