
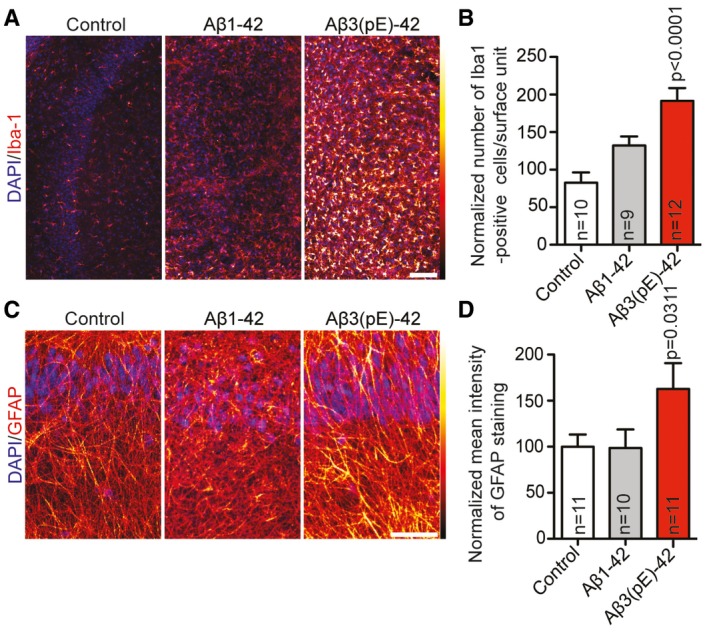
Figure EV3. Aβ3(pE)‐42 causes prominent microglia and astroglia activation.
-
A–DMurine organotypic slices were treated with Aβ1‐42 or Aβ3(pE)‐42 for 3 days. Confocal images of slices stained for (A) Iba‐1 or (C) GFAP indicate that there is an increased activation of microglia and astrocytes. Scale bar, 100 μm. Bar graphs show quantification of (B) Iba‐1‐positive cells and (D) mean GFAP fluorescence intensity. Original pixel intensities from 0 to 255 are represented as a gradient lookup table. Scale bar, 10 μm. n corresponds to the number of slices from at least two independent experiments. P‐values versus control by one‐way ANOVA. Data are represented as mean ± s.e.m.