
Figure EV5. 1.8 nM TNFα causes synapse loss and reduction in dendritic tree complexity.
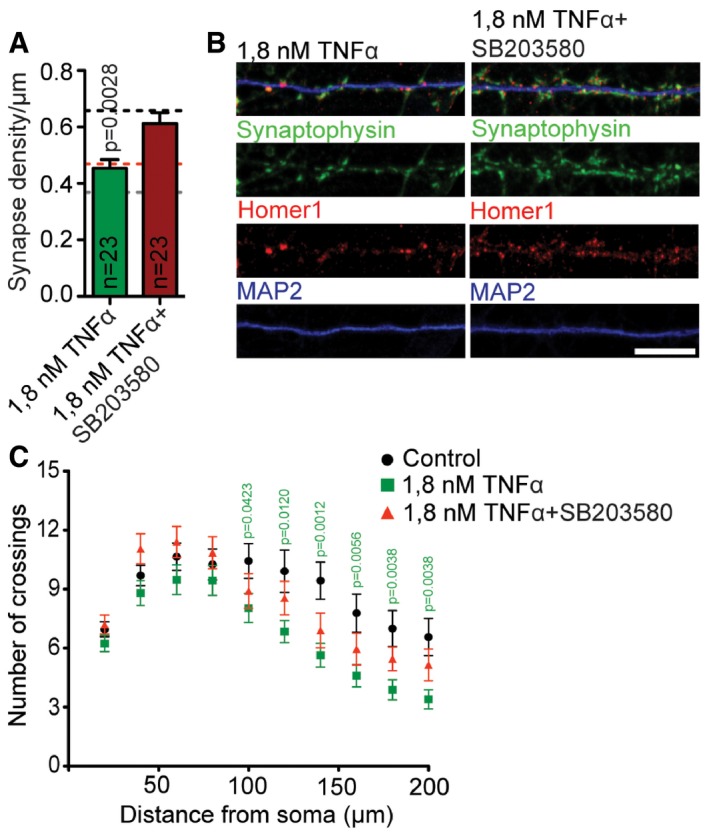
- Bar plots representing mean synapse density after treatment with 1.8 nM TNFα with or without co‐application of SB203580. 1.8 nM TNFα causes synaptic loss that can be rescued by SB203580 application. Dashed lines indicate mean synapse density from Fig 1B: black, control; grey, Aβ1‐42 treatment; red, Aβ3(pE)‐42 treatment. n corresponds to the number of different dendritic segments from different neurons analysed from at least four independent coverslips and at least two independent cell cultures.
- Confocal images of representative dendrites stained for Homer1, Synaptophysin and MAP2. Scale bar, 10 μm.
- 1.8 nM TNFα causes dendritic tree simplification that can be rescued by SB203580 application. Graph representing results of Sholl analysis of RFP‐transfected neurons treated with 1.8 nM TNFα (n = 25) with or without SB203580 (n = 20) and control (n = 23). n corresponds to the number of neurons analysed from at least three independent coverslips and at least two independent cell cultures.