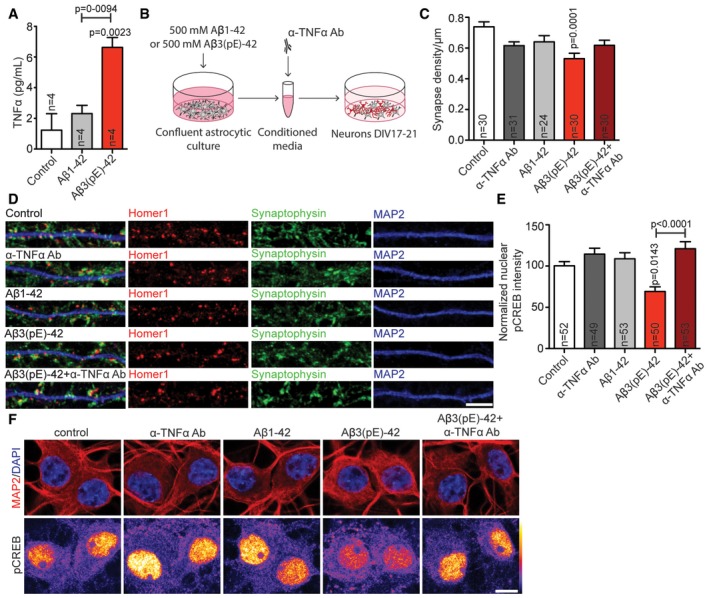
Figure 7. Aβ3(pE)‐42 causes astrocytic TNFα‐driven synaptic dysfunction.

-
ABar plot representing TNFα content in astrocytic lysate after treatment with Aβ1‐42 or Aβ3(pE)‐42 measured by ELISA. Only in case of Aβ3(pE)‐42, there is significant increase in TNFα. n corresponds to the number of flasks from 2 different experiments.
-
BScheme representing stimulation with glia‐conditioned media.
-
C, DMedium from astrocytes treated with Aβ1‐42 or Aβ3(pE)‐42 cause decrease in synaptic density only in case of Aβ3(pE)‐42. The depletion with anti‐TNFα antibody prevents synaptic loss. n corresponds to the number of separate dendritic segments on different neurons analysed from at least three independent coverslips and at least two independent cell cultures. (D) Confocal images of representative dendrites stained for Homer1, Synaptophysin and MAP2. Scale bar, 5 μm.
-
EThe decrease in nuclear pCREB intensity occurs only in case of media from astrocytes treated with Aβ3(pE)‐42 and can be rescued by depletion with an anti‐TNFα antibody (Ab). n corresponds to the number of nuclei from different neurons analysed from at least four independent coverslips and at least two independent cell cultures.
-
FConfocal images of DIV18 neurons stained for pCREB. Original pixel intensities from 0 to 255 are represented as a gradient lookup table. Scale bar, 10 μm.
