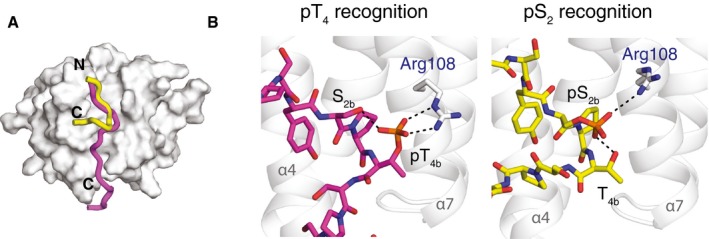
Figure 3. Degeneracy of the CTD code.

- Superposition of pThr4‐CTD (magenta; PDB ID: 5LVF) and pSer2‐CTD (yellow; PDB ID: 2L0I) peptides on the Rtt103p CID surface (grey). N‐ and C‐termini of the peptides are indicated.
- Close view on the phospho‐recognition site of Rtt103p CID. Interaction of pThr4‐ (magenta sticks, left) and pSer2‐CTD (yellow sticks, right) peptides with Arg108 (grey). Hydrogen bonds of the phospho‐groups are indicated with black dashed lines.
