-
A
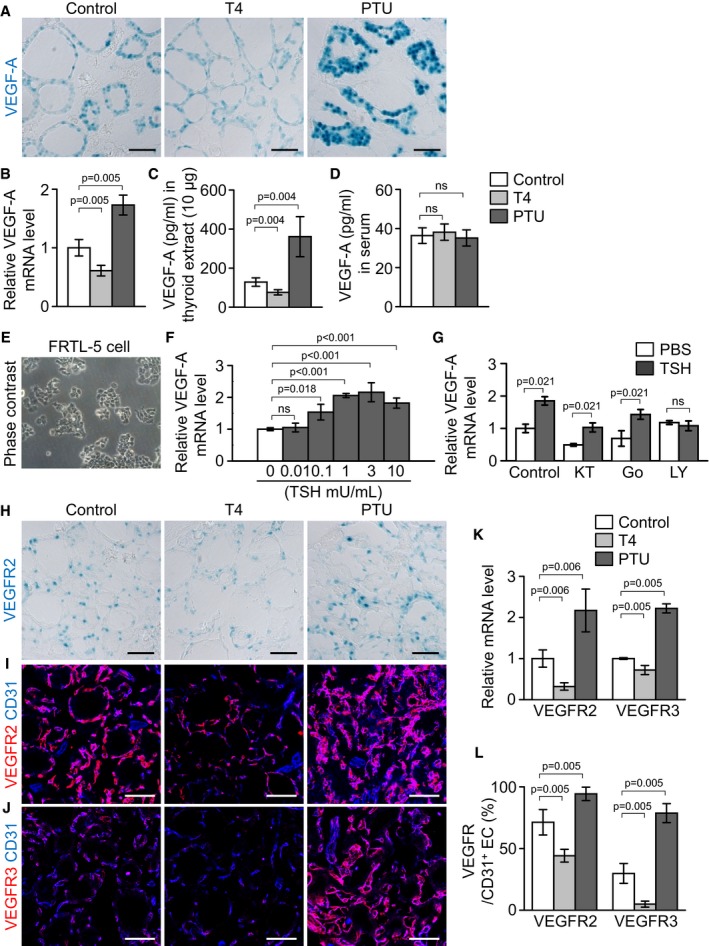
Images showing X‐gal‐stained VEGF‐A in the thyroid glands of VEGF‐A+/LacZ mice.
-
B–D
Comparisons of VEGF‐A mRNA and protein levels in thyroid glands, and circulating VEGF‐A levels in serum.
-
E
Phase contrast image of cultured rat thyroid follicular cell line, FRTL‐5.
-
F
Increases of VEGF‐A mRNA expression in FRTL‐5 cells at 3 h after TSH stimulation.
-
G
Comparisons of VEGF‐A mRNA levels in FRTL‐5 cells after supplement with cell signal inhibitors. Cells were pretreated for 1 h with KT5720 (KT, 3 μM), Go6976 (Go, 0.1 μM), or LY294002 (LY, 20 μM) before TSH (1 mU/ml) supplementation.
-
H
Images showing X‐gal‐stained VEGFR2 in the thyroid glands of VEGFR2+/LacZ mice.
-
I, J
Immunofluorescence images showing expression of VEGFR2 and VEGFR3.
-
K
Comparisons of VEGFR2 and VEGFR3 mRNA levels.
-
L
Comparisons of expression of VEGFR2 and VEGFR3 (relative percentage to the levels of CD31) proteins.
Data information: Each group,
n = 4 in (B, C, D, K, and L). Each group,
n = 3 in (F and G). Error bars represent mean ± s.d. Kruskal–Wallis test followed by Tukey's multiple comparison test was used in (B, C, D, F, K, and L). Mann–Whitney
U‐test was used in (G). ns, not significant. Scale bars, 50 μm.

