-
A
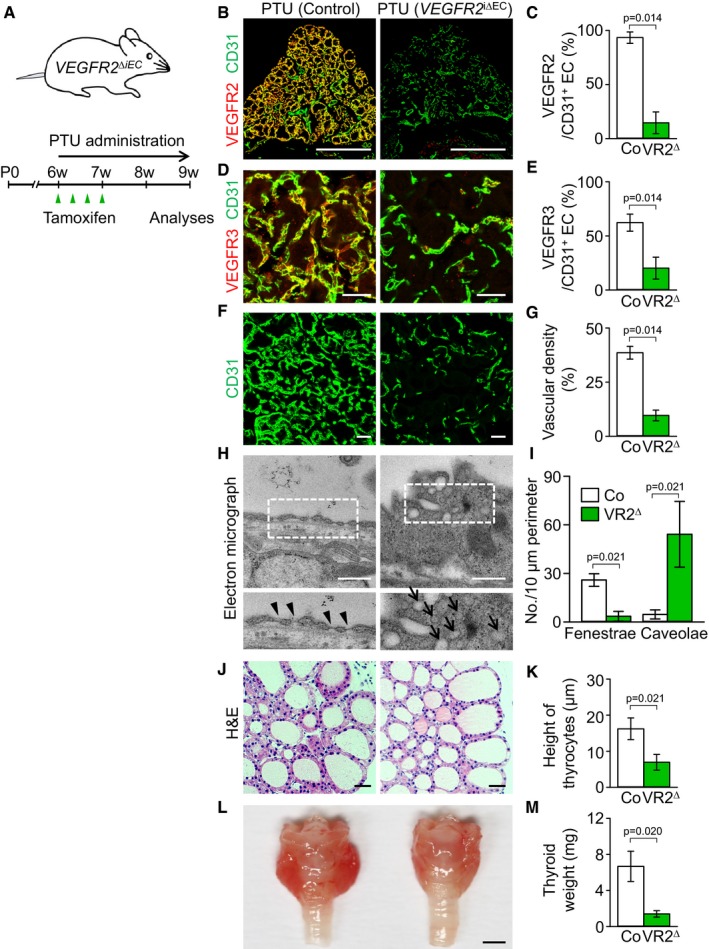
Diagram showing PTU administration into VEGFR2
i∆EC mice.
-
B–K
Images and comparisons of (B–E) expression of VEGFR2 and VEGFR3, (F, G) CD31+ BV density, (H, I) fenestrae (arrowheads) and caveolae (arrows), and (J, K) height of thyrocytes in VEGFR2
i∆EC (VR2∆) and their littermate controls (Co) after 3 weeks of PTU administration. All scale bars, 50 μm except scale bars in (B), 500 μm, and scale bars in (H), 0.5 μm.
-
L, M
Gross images and comparisons of thyroid weights after 3 weeks of PTU administration in VEGFR2
i∆EC mice compared with Co. Scale bar, 1 mm.
Data information: Each group,
n = 4–5. Error bars represent mean ± s.d. Mann–Whitney
U‐test was used in (C, E, G, I, K, and M).

