-
A
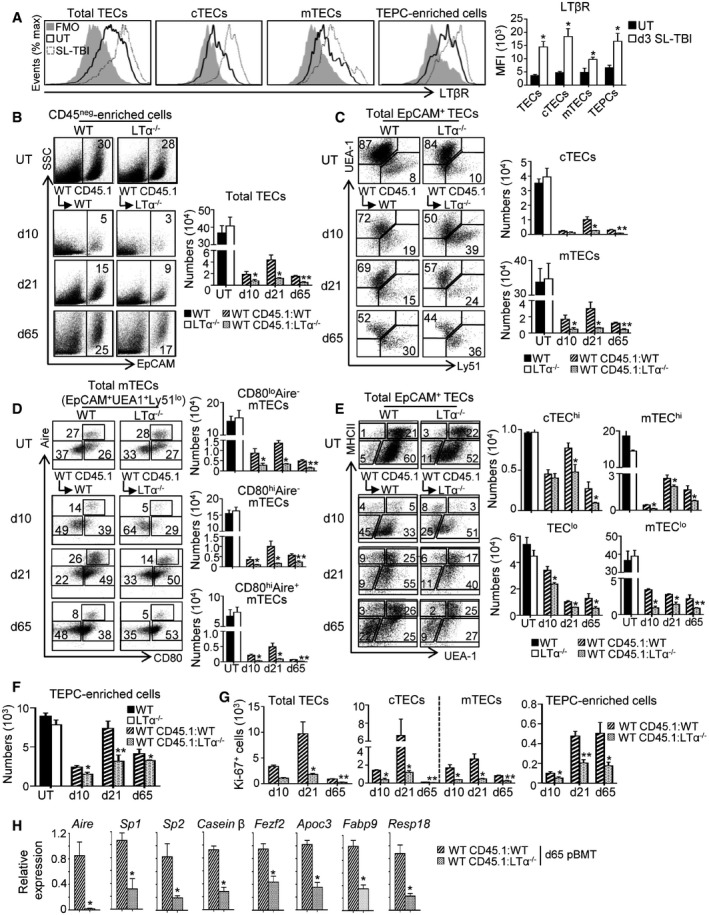
Expression level of LTβR protein in total TECs, cTECs, mTECs, and TEPC‐enriched cells from the thymus of UT WT mice (n = 6) and at d3 SL‐TBI (n = 6) was analyzed by flow cytometry. FMO: Fluorescence Minus One.
-
B–F
Flow cytometry profiles and numbers of total TECs (B); cTECs, mTECs (C); mTEC subsets (D); cTEChi, mTEChi, TEClo, mTEClo (E); and TEPC‐enriched cells (F) were analyzed in CD45neg‐enriched cells by AutoMACS from the thymus of UT WT and LTα−/− mice or in WT CD45.1:WT and WT CD45.1:LTα−/− chimeras at d10, d21, and d65 upon BMT.
-
G
Numbers of total proliferating Ki‐67+ TECs, cTECs, mTECs, and TEPC‐enriched cells at the indicated time points.
-
H
The expression of mRNAs coding for Aire, Aire‐induced TRAs (Sp1 and Sp2); Aire‐independent TRA (casein β); Fezf2 and Fezf2‐induced TRAs (Apoc3, Fabp9, and Resp18) was measured by qPCR in CD45− thymic stromal cells from WT CD45.1:WT and WT CD45.1:LTα−/− mice at d65 after BMT. Significance relative to WT CD45.1:WT chimeras.
Data information: Data are shown as mean ± SEM and are pooled of three independent experiments with similar results (
= 3–5 mice per group). *
< 0.01. Exact
.

