
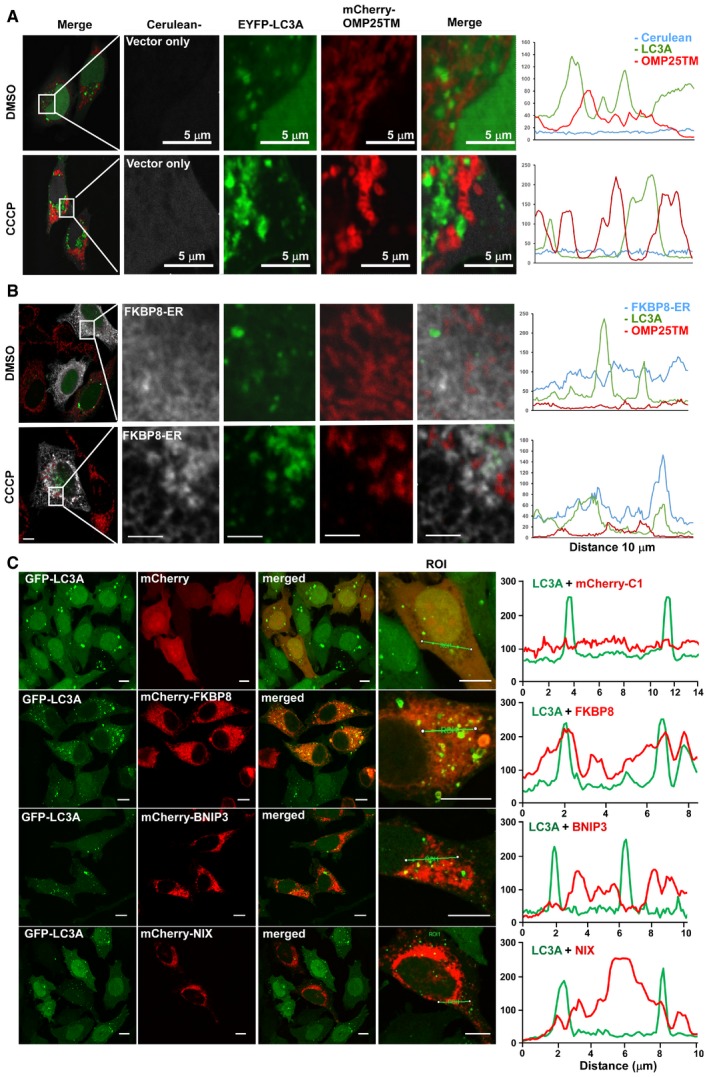
Figure EV3. FKBP8‐ER recruits LC3A to the ER upon CCCP treatment.
-
A, BHeLa cells were co‐transfected with Cerulean vector control (A) or Myc‐FKBP8‐ER (B), EYFP‐LC3A, and mCherry‐OMP25TM expression constructs. The cells were treated with DMSO or 10 μM CCCP for 4 h and imaged by a Leica SP5 fluorescence confocal microscope. Scale bars, 10 μm; in zoomed images, 5 μm. Line‐profile co‐localization plots of Cerulean or FKBP8 ER (blue line), EYFP‐LC3A (green line), and OMP25TM (red line) were made using the line‐profile quantification tool in the Leica imaging software (LAS‐AF). The vertical axes represent measurements of fluorescent intensity and the horizontal axis the drawn distances.
-
CA HeLa cell line stably expressing GFP‐LC3A was transfected with plasmids expressing the indicated mCherry‐fusion proteins imaged by a Leica SP5 confocal microscope. Scale bars, 10 μm. Line‐profile co‐localization of plots of GFP‐LC3A (green line) and mCherry vector control, mCherry‐FKBP8, mCherry‐NIX, or mCherry‐BNIP3 (red lines) were made using the line‐profile quantification tool in Leica imaging software. The measurements of the intensity (y‐axis) and distance (x‐axis in μm) are plotted on the graph.