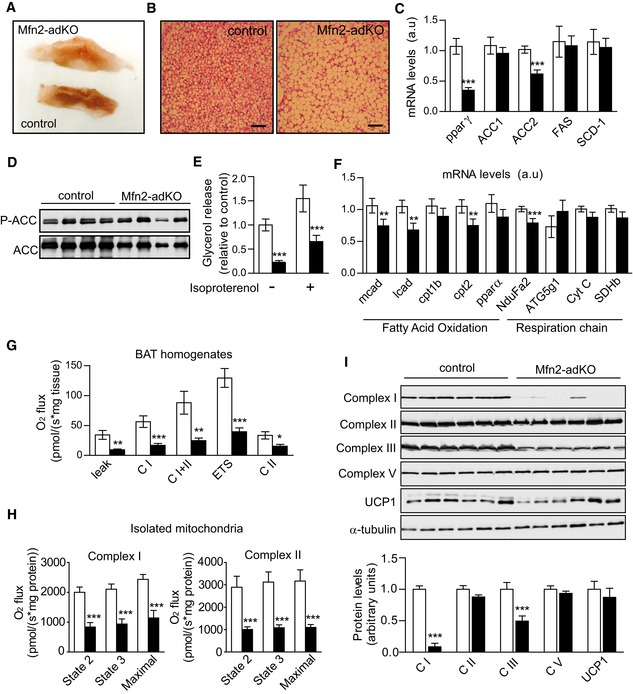
Brown adipose tissue (BAT) pictures from male control and Mfn2‐adKO mice.
Hematoxylin/eosin staining of BAT (scale bar, 100 μm).
Total mRNA was extracted from BAT and used for qPCR analysis.
Western blots were performed to evaluate the ACC phosphorylation in BAT.
Lipolysis was evaluated by measuring glycerol release in isolated BAT from mice after 5‐h treatment with vehicle or isoproterenol (1 μM).
Fatty acid oxidation and respiratory chain‐related gene expression in BAT was analyzed by qPCR.
Respirometry analyses of uncoupled respiration (leak), Complex I respiration (CI), Complex I + Complex II respiration (CI + CII), maximal electron transfer system (ETS) capacity, and maximal Complex II driven respiration (ETS CII) in BAT.
Respirometry analyses were performed in isolated mitochondria from BAT of male (n = 3 per genotype) and female (n = 3 per genotype) control and Mfn2‐adKO mice. On the left, malate (2 mM) and glutamate (10 mM) were used to stimulate Complex I and State 2, State 3 and maximal respiration were evaluated. On the right, succinate (10 mM) and rotenone (0.5 μM) were used to evaluate Complex II State 2, State 3, and maximal respiration.
Mitochondrial proteins levels in total homogenates from BAT. Quantifications are shown below the images.
Data information: Unless otherwise stated, all values are presented as mean ± SEM of
n = 10 mice for each genotype. *, **, and *** indicate statistically significant difference between control (white bars) and Mfn2‐adKO mice (black bars) at
P < 0.05,
P < 0.03, and
P < 0.01, respectively (two‐tailed Student's
t‐test).