
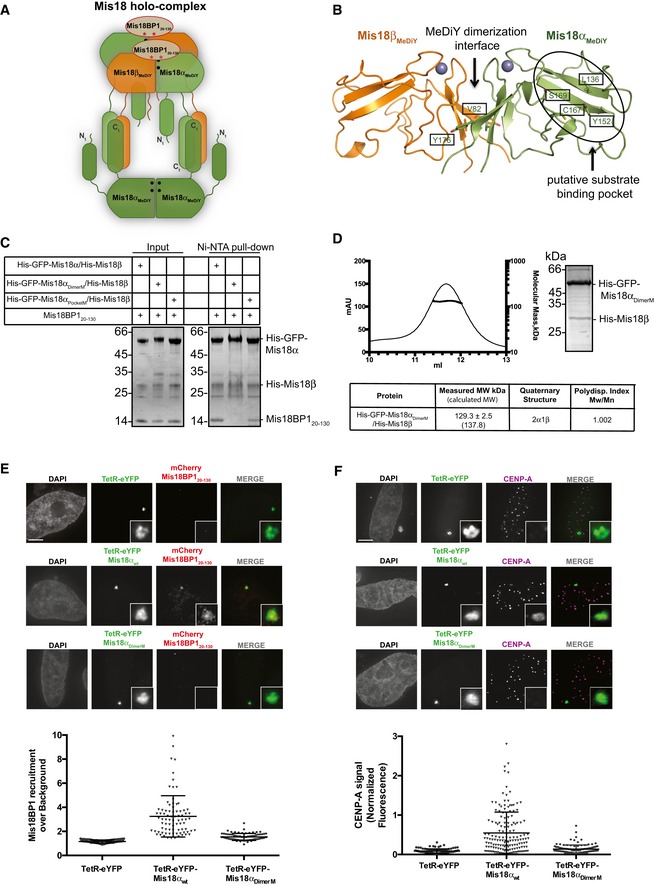
Figure 4. Hetero‐hexamerization of Mis18α/β mediated via the MeDiY domain is required for Mis18BP1 binding and CENP‐A loading in vivo .
-
AProposed model for Mis18 complex assembly. Our data showing that the Mis18 holo‐complex contains just two copies of Mis18BP1 (Fig 3F and G) and that Mis18αMeDiY/βMeDiY hetero‐dimer binds Mis18BP120‐130 more robustly as compared to Mis18αMeDiY (Fig 2D) suggest that Mis18BP1 prefers Mis18αMeDiY/βMeDiY hetero‐dimer over Mis18αMeDiY. Filled circles (•) and asterisks (*) represent the sites of Mis18α residues involved in MeDiY dimerization (V82 and Y176; Fig 4B) and consensus Cdk1 phosphorylation on Mis18BP120–130 (T40 and S110; Fig 5A), respectively.
-
BCartoon representation of the homology‐modeled human Mis18αMeDiY/βMeDiY hetero‐dimer (with Phyre2 web server, www.sbg.bio.ic.ac.uk/phyre2/, using S. pombe Mis18 MeDiY domain—PDB: 5HJ0). Key amino acid residues forming the dimeric interface and putative substrate‐binding pocket are shown in stick representation. Residues mutated in this study are highlighted by boxes.
-
CSDS–PAGE analysis of the Ni‐NTA pull‐down assay where recombinant His‐GFP‐Mis18αwt/His‐Mis18β, His‐GFP‐Mis18αPocketM/His‐Mis18β, and His‐GFP‐Mis18αDimerM/His‐Mis18β were mixed with Mis18BP120–130. Left panel: inputs and right panel: Ni‐NTA pull‐down.
-
DSEC‐MALS profile of His‐GFP‐Mis18αDimerM/His‐Mis18β. Absorption at 280 nm (mAU, left y‐axis) and molecular mass (kDa, right y‐axis) plotted against elution volume (ml, x‐axis).
-
E, FRepresentative fluorescence images (top) and quantification (bottom) for the ability of TetR‐eYFP, TetR‐eYFP‐Mis18αwt, and TetR‐eYFP‐Mis18αDimerM (E) to recruit mCherry‐Mis18BP120–130 to the alphoidtetO array (Mann–Whitney test vs. TetR‐eYFP; P ≤ 0.0001, n ≥ 78) and (F) to deposit CENP‐A at the tethering site (Mann–Whitney test vs. TetR‐eYFP; P ≤ 0.0001, n ≥ 106). Middle bars show median whilst error bars show SEM. Scale bars, 5 μm. Data for TetR‐eYFP‐Mis18αwt/mCherry‐Mis18BP120–130‐transfected cells (Fig 1B) have been used as a control.