
Figure 5. Consensus Cdk1 phosphorylation sites of Mis18BP1, T40, and S110, are directly involved in Mis18α/β binding.
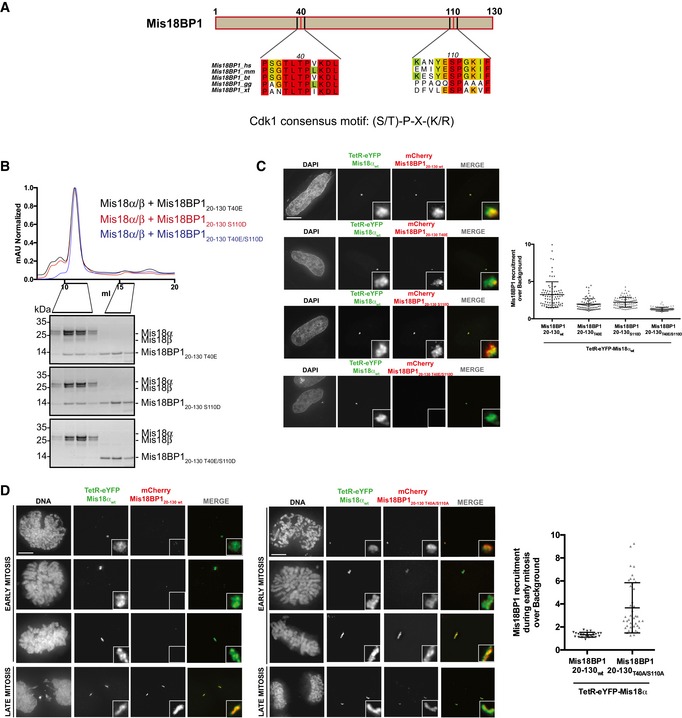
- Multiple sequence alignment of amino acid stretches containing the consensus Cdk1 phosphorylation sites within Mis18BP120–130. Alignments include Homo sapiens (hs), Mus musculus (mm), Bos taurus (bt), Gallus gallus (gg), and Xenopus tropicalis (xt). Multiple sequence alignment (conservation score is mapped from red to cyan, where red corresponds to highly conserved and cyan to poorly conserved) was performed with MUSCLE 31 and edited with Aline 32.
- SEC profiles and respective SDS–PAGE analysis of Mis18α/β mixed with molar excess of Cdk1 phospho‐mimic mutants, Mis18BP120–130 T40E, Mis18BP120–130 S110D, and Mis18BP120–130 T40E/S110D.
- Representative images (left) and quantification (right) for the recruitment of different mCherry‐Mis18BP120–130 Cdk1 phospho‐mimic mutants (T40E, S110D or T40E/S110D) to the alphoidtetO array in HeLa 3‐8 cells expressing TetR‐eYFP‐Mis18α. Middle bars show median whilst error bars show SEM. Mann–Whitney test vs. TetR‐eYFP; P ≤ 0.0001, n ≥ 78. Scale bar, 10 μm. Data for TetR‐eYFP‐Mis18αwt/mCherry‐Mis18BP120–130‐transfected cells (Fig 1B) have been used as a control.
- Representative images (left) for the cell cycle‐dependent and independent recruitment of mCherry‐Mis18BP120–130 wt and mCherry‐Mis18BP120–130 T40A/S110A, respectively, to the alphoidtetO array in HeLa 3‐8 cells expressing TetR‐eYFP‐Mis18α. Quantification (right) of Mis18BP120–130 wt and Mis18BP120–130 T40A/S110A recruitment to the array during early mitosis. Middle bars show median whilst error bars show SEM. Mann–Whitney test vs. Mis18BP120–130 wt; P ≤ 0.0001, n = 23 (mCherry‐Mis18BP120–130 wt) and n = 41 (mCherry‐Mis18BP120–130 T40A/S110A). Scale bar, 10 μm.