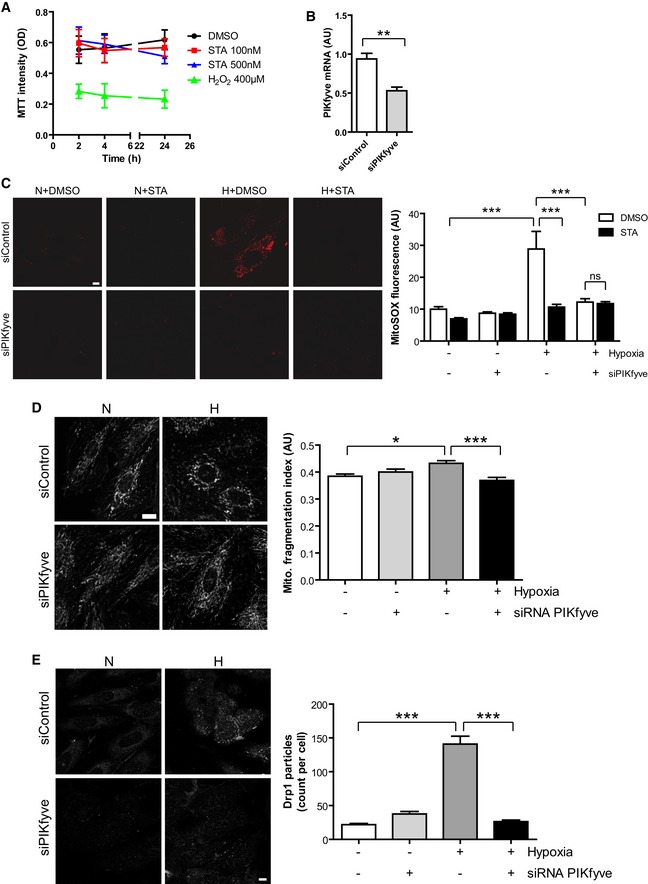
Figure EV1. Silencing of PIKfyve recapitulates STA protective effects on mitochondria.

- H9C2 cells were treated with DMSO, STA or H2O2 for the indicated time and cell viability was assessed by MTT staining. Results are from three independent experiments.
- H9C2 cells were transfected with a control siRNA (siControl) or a siRNA targeting PIKfyve (siPIKfyve). PIKfyve mRNA level was measured by qRT‐PCR. Student's test, **P < 0.01 (n = 3).
- H9C2 cells were transfected as in (B), submitted to hypoxia (H) or kept in normoxia (N) in the presence of STA or DMSO alone. Mitochondrial ROS production was followed using MitoSOX. Scale bar is 10 μm. Quantification is shown on the right. Bonferroni's post hoc test: ***P < 0.001 between indicated conditions. ns, non‐significant (n = 22–65).
- Cells transfected with a PIKfyve‐siRNA were live‐stained with MitoTracker to assess mitochondrial structure in normoxic (N) or hypoxic (H) conditions (left panel). Scale bar is 10 μm. Right panel shows quantification of mitochondrial fragmentation. Bonferroni's post hoc test: *P < 0.05 and ***P < 0.001 between indicated conditions (n = 11–23).
- Cells were treated as in (D), fixed and stained for endogenous Drp1 to follow its oligomerization. Scale bar is 10 μm. Quantification of Drp1 particles per cell is shown on the right. Bonferroni's post hoc test: ***P < 0.001 between indicated conditions (n = 35–53).
