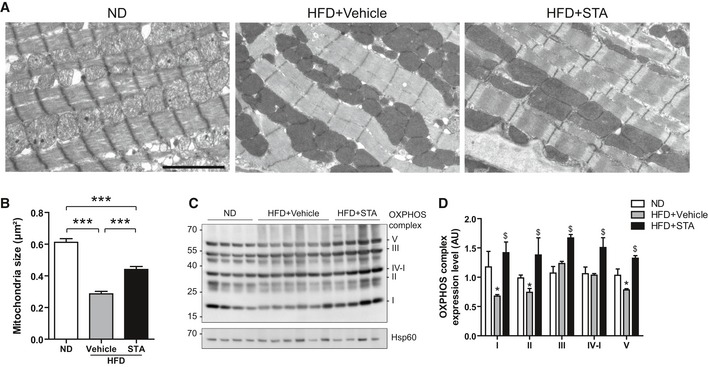
Figure 7. Chronic STA treatment reduces mitochondrial damages in obese mice.

- Electron micrographs showing preservation of myocardial mitochondrial structure in HFD STA‐treated mice. Scale bar is 1 μm.
- Quantification of mitochondria size from (A). Data are presented as mean ± SEM. Student's t‐test, ***P < 0.001 between indicated conditions, n = 4–6 mice per group.
- Expression of several OXPHOS complexes was measured by Western blot on heart lysates.
- Quantification of OXPHOS complexes expression from (C). Data are presented as mean ± SEM. Student's t‐test, *P < 0.05 as compared with ND, $ P < 0.05 as compared with HFD+Vehicle. n = 3–6 mice per group.
Source data are available online for this figure.
