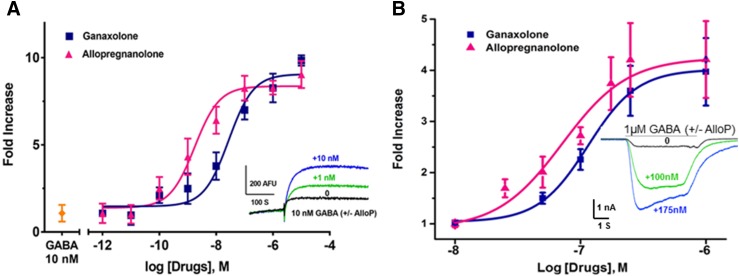
Fig. 9.
Allopregnanolone and ganaxolone potentiation of GABA responses of α1β3γ2 GABAAR in HEK 293 cells. (A) Concentration-response curves for allopregnanolone and ganaxolone potentiation of FMP-Red Dye responses to 10 nM GABA. The graph plots mean ± S.D. fold increase in peak response in the presence the NAS compared with the response to 10 nM GABA alone. Each data point is the mean ± S.D. of measurements of 10 wells. The EC50 values for allopregnanolone and ganaxolone are 1.7 nM [95% confidence interval (CI): 1–3.1 nM (nH = 1.5)] and 20 nM [95% CI: 14–55 nM (nH = 1.4)], respectively (P < 0.0001). Dose-response curves were plotted using nonlinear regression with a four-parameter logistic equation and independent F test was applied to determine the statistical differences for EC50 values and slopes between allopregnanolone and ganaxolone in combination with 10 nM GABA in α1β3γ2 GABAAR in HEK 293 cells. Inset shows representative traces with addition of GABA alone and GABA plus allopregnanolone at concentrations of 1 and 10 nM. (B) Concentration-response curves for allopregnanolone and ganaxolone potentiation of peak inward Cl− current responses to 1 μM GABA (EC10 value) in patch-clamp recordings. Each data point is the mean ± S.D. of measurements of 3–6 cells. The EC50 values for allopregnanolone and ganaxolone are 71.3 nΜ [95% CI: 57.1–85.5 nM (nH = 1.8)] and 114.8 nΜ [95% CI: 99.2–130.4 nM (nH = 2.2)], respectively. Inset shows representative traces with application of GABA alone and GABA plus allopregnanolone at 100 and 175 nM.

