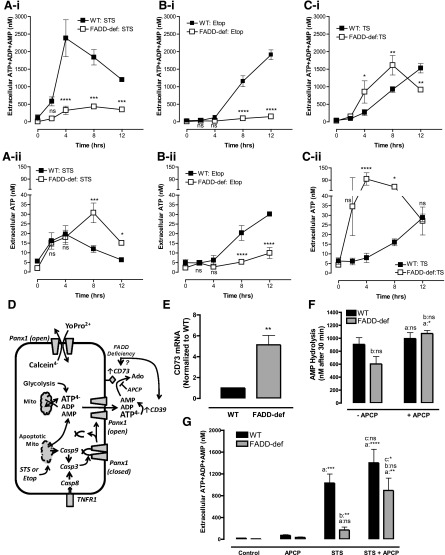
Fig. 4.
CD73 ecto-5′-nucleotidase is up-regulated in FADD-deficient Jurkat cells to rapidly metabolize AMP released during apoptosis or necroptosis. (A–C) WT and FADD-deficient cells were treated with 3 μM STS (A-i and A-ii), 20 μM Etop (B-i and B-ii), or TNFα plus BV6 Smac-mimetic (TS) (C-i and C-ii). Conditioned medium samples were collected at 0, 2, 4, 8, and 12 hours and assayed for either summed ATP + ADP + AMP (A-i; B-i, C-i) or ATP only (A-ii, B-ii, C-ii). Data indicate mean ± S.E. of three experiments and statistical analyses (two-way analysis of variance with Tukey post-test comparison) of the values of FADD-def versus WT at each time point. (D) Schematic of interactions between Panx1 channel-mediated adenine nucleotide efflux and metabolism of the released nucleotides by CD39 and CD73 ectonucleotidases (APCP) during extrinsic or intrinsic apoptosis. (E) qRT-PCR analysis of CD73 mRNA expression in WT and FADD-deficient cells. Signals in FADD-def were normalized to signals in WT and represent values from three independent experiments; analysis by two-tailed t test. (F) We added 1 μM exogenous AMP to suspensions (2 × 10⁶/ml) of untreated WT or FADD-deficient Jurkat cells in the presence or absence of 50 μM APCP. Cell-free supernatants were collected after 30 minutes and analyzed for the concentration of remaining [AMP]. Data indicate mean ±S.E. of four independent experiments with WT cells and three independent experiments with FADD-def cells. Analysis by two-way analysis of variance and Tukey post-test comparison; a: +APCP versus −APCP; b: FADD-def versus WT. (G) WT or FADD-deficient Jurkat cells were treated with 3 μM STS for 4 hours in the absence or presence of 50 μM APCP. Conditioned medium samples were collected and assayed for summed ATP + ADP + AMP. Data indicate mean ± S.E. of six independent experiments with WT cells and five independent experiments with FADD-def cells. Analysis by two-way analysis of variance and Tukey post-test comparison; a: +STS versus −STS; b: FADD-def versus WT; c: +STS with APCP versus STS alone. All panels: ns, not statistically significant; *P < 0.05; **P < 0.01; ***P < 0.001; ****P < 0.0001.

