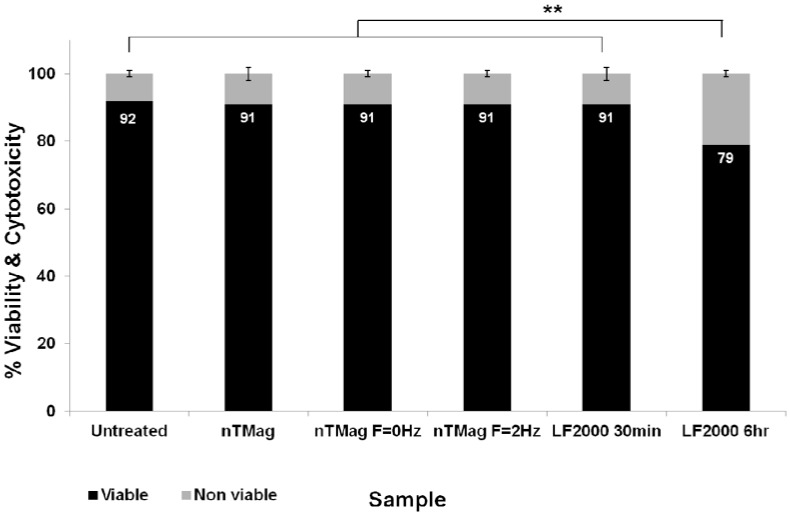
Figure 5.
Bar chart showing combined average percentage for viable and non-viable cells following treatment with nTMag MNPs and “no field”, “static field” (f = 0 Hz) and “magnefect-nano” (f = 2 Hz) transfections at 30 min, compared with Lipofectamine 2000 at 30 min and 6 h, at 48 h post-transfection. n = 9 for all groups.

