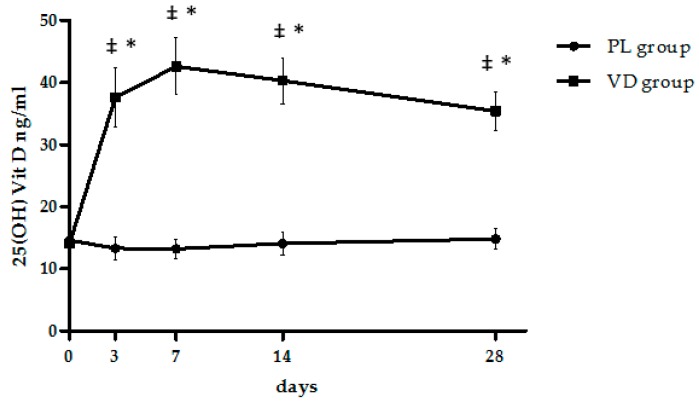
Figure 1.
Effect of cholecalciferol or placebo administration on serum 25(OH)Vit D levels. Data are presented as mean ± SEM. For significance: * p < 0.001 vs. baseline within group, as calculated by repeated measures one-way ANOVA; ‡ p < 0.0001 between groups by unpaired t-test. Two-way ANOVA was also performed to test the effect of time, treatment, and time × treatment interaction, and results are summarized in the text and Table 1.

