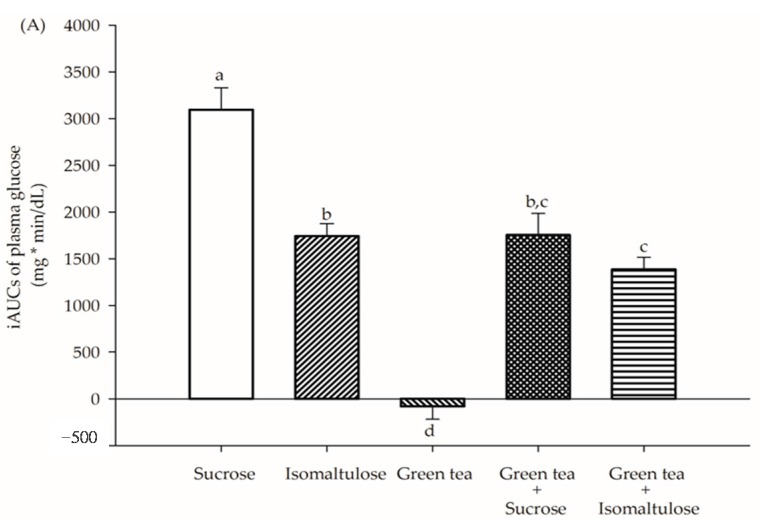
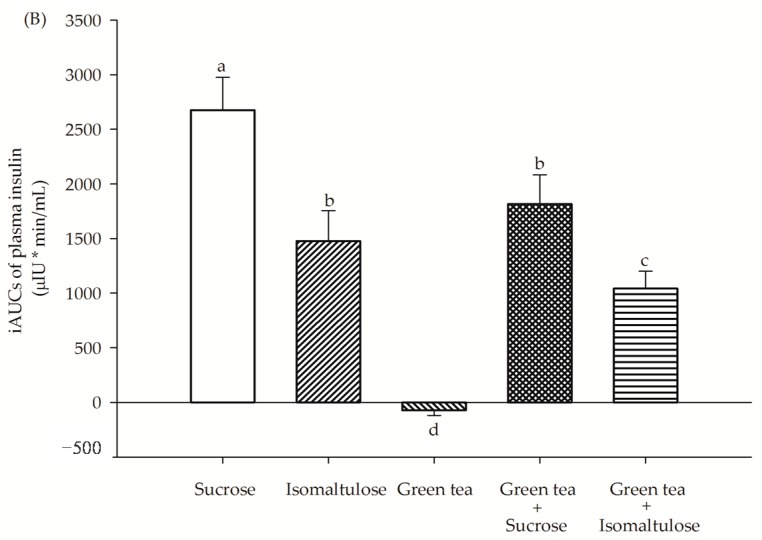
Figure 3.
The incremental area under the curves (iAUCs) of plasma (A) glucose and (B) insulin concentration in healthy subjects after consumption of sucrose, isomaltulose, green tea, green tea plus sucrose and green tea plus isomaltulose (n = 15). Data are expressed as means ± SEM. Values not sharing the same superscript were significantly different between test groups (p < 0.05).


