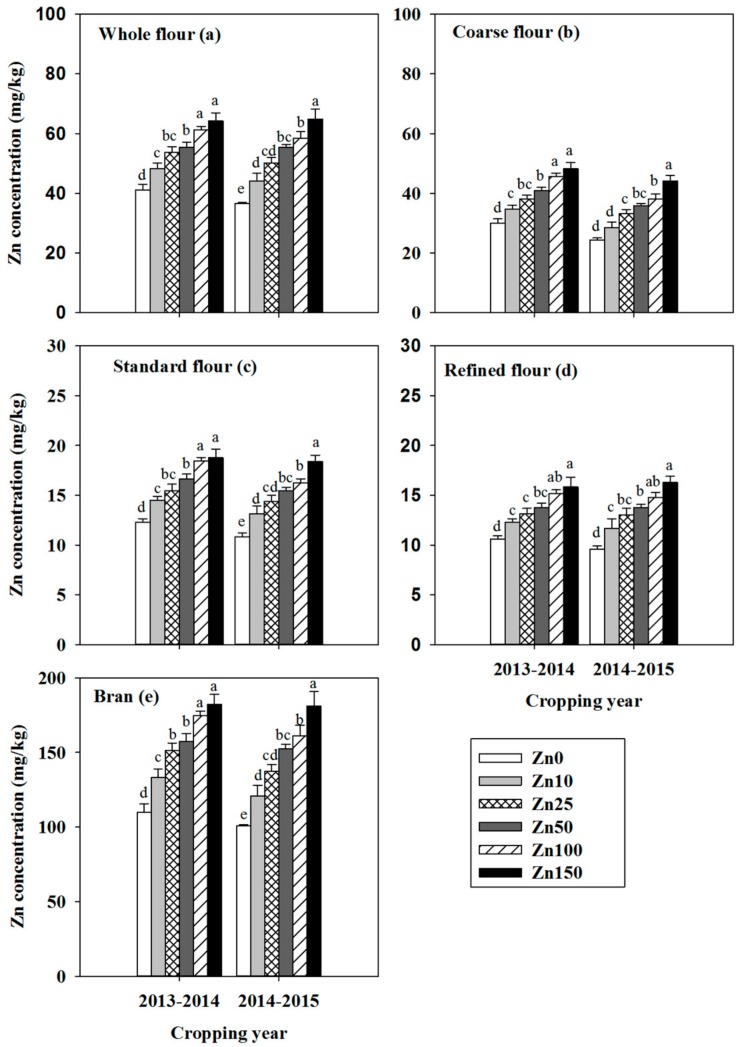
Figure 1.
Zinc concentration in wheat whole flour (a); coarse flour (b); standard flour (c); refined flour (d); and bran (e) as affected by the quantity of Zn fertilizer applied (0 to 150 kg of ZnSO4·7H2O/ha) in 2013–2014 and 2014–2015. Values are means + SE (n = 4). Within each panel and cropping year, means with different letters are significantly different at p < 0.05. Note that the Y-axis scale is not constant among panels.

