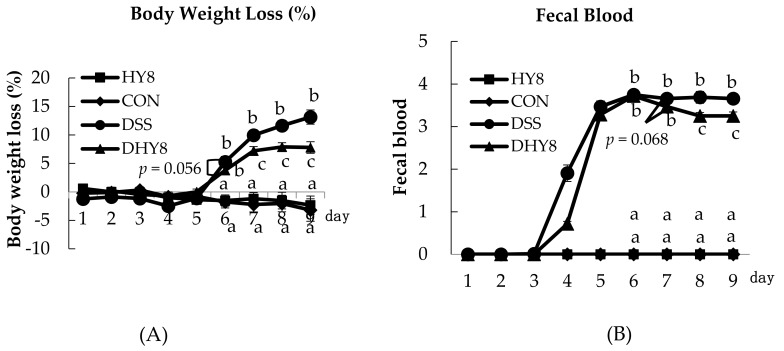
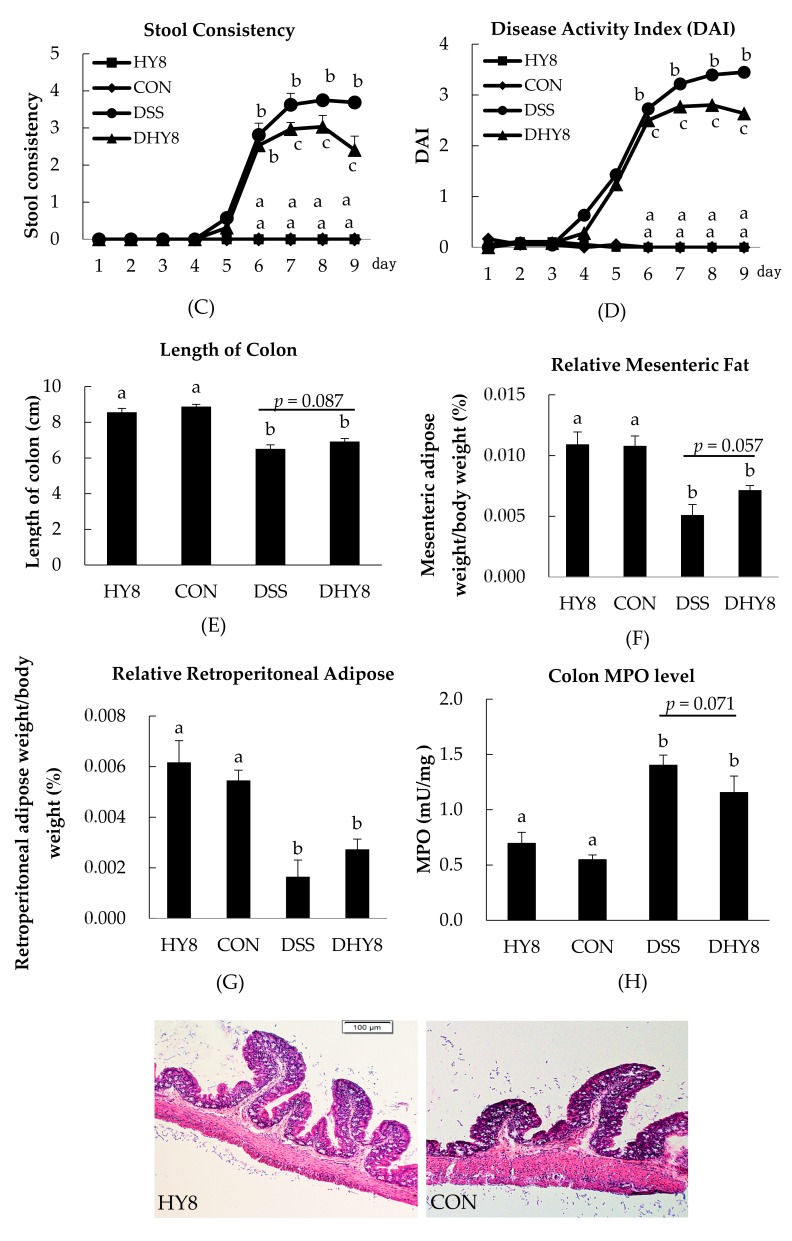
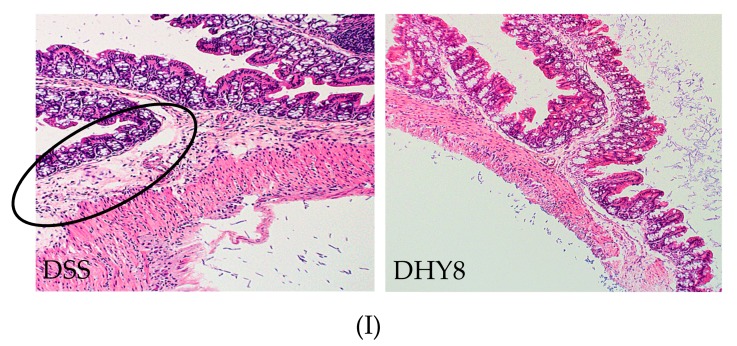
Figure 1.
General characters of each groups. (A) Body weight loss; (B) Fecal blood; (C) Stool consistency; (D) Disease Activity Index (DAI); (E) Length of colon; (F) Relative mesenteric fat; (G) Relative retroperitoneal adipose; (H) Colon MPO level; (I) Hematoxylin and eosin (H&E) staining of colon. All values are mean ± SE (n = 6–8) by two-way ANOVA.


