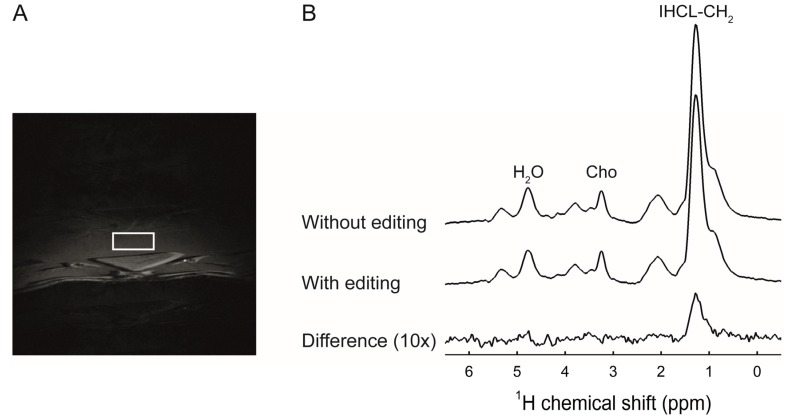
Figure 2.
(A) T1-weighted transversal image of the abdomen of a rat receiving a 13% (w/v) fructose solution. The positioning of a 5 × 2 × 4 mm3 voxel in the median lobe of the liver for 1H-[13C] magnetic resonance spectroscopy (MRS) is indicated by the white square; (B) 1H-[13C] MRS spectra from the voxel in panel A. Spectra were acquired after 5 days of [U-13C6]glucose administration. Spectra without 13C editing, with 13C editing, and the calculated difference spectrum containing only 13C-coupled 1H resonances (10× magnification) are shown. Peak annotations: Cho, choline; IHCL, intrahepatocellular lipids. Total IHCL content was quantified from the spectrum without 13C editing and 13C-enriched IHCL content was determined from the difference spectrum.

