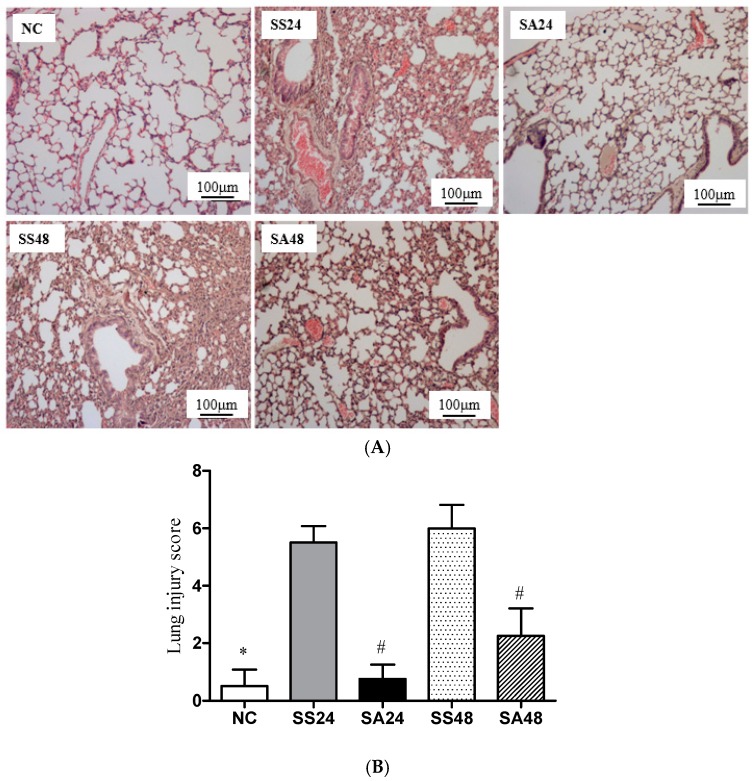
Figure 3.
(A) Histopathology of the lung tissues; (B) Quantification of histological lung injury scores. All data are representative of duplicate measurements (n = 6). Data are presented as the mean ± SD. * Significantly differs from the sepsis group. # Significantly differs from the SS group at the same time point (p < 0.05).

