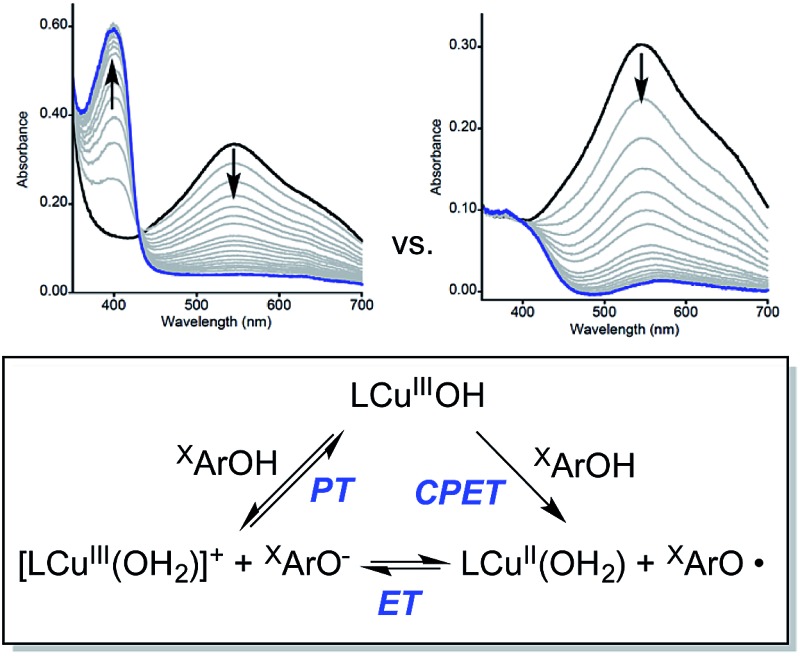
 Kinetic studies of the reactions of two previously characterized copper(III)-hydroxide complexes with a series of para substituted phenols (XArOH where X = NMe2, OMe, Me, H, Cl, NO2, or CF3) indicate competition between concerted CPET and sequential PT/ET pathways.
Abstract
Kinetic studies of the reactions of two previously characterized copper(iii)-hydroxide complexes (LCuOH and NO2LCuOH, where L = N,N′-bis(2,6-diisopropylphenyl)-2,6-pyridine-dicarboxamide and NO2L = N,N′-bis(2,6-diisopropyl-4-nitrophenyl)pyridine-2,6-dicarboxamide) with a series of para substituted phenols (XArOH where X = NMe2, OMe, Me, H, Cl, NO2, or CF3) were performed using low temperature stopped-flow UV-vis spectroscopy. Second-order rate constants (k) were determined from pseudo first-order and stoichiometric experiments, and follow the trends CF3 < NO2 < Cl < H < Me < OMe < NMe2 and LCuOH < NO2LCuOH. The data support a concerted proton–electron transfer (CPET) mechanism for all but the most acidic phenols (X = NO2 and CF3), for which a more complicated mechanism is proposed. For the case of the reactions between NO2ArOH and LCuOH in particular, competition between a CPET pathway and one involving initial proton transfer followed by electron transfer (PT/ET) is supported by multiwavelength global analysis of the kinetic data, formation of the phenoxide NO2ArO– as a reaction product, observation of an intermediate [LCu(OH2)]+ species derived from proton transfer from NO2ArOH to LCuOH, and thermodynamic arguments indicating that initial PT should be competitive with CPET.
Introduction
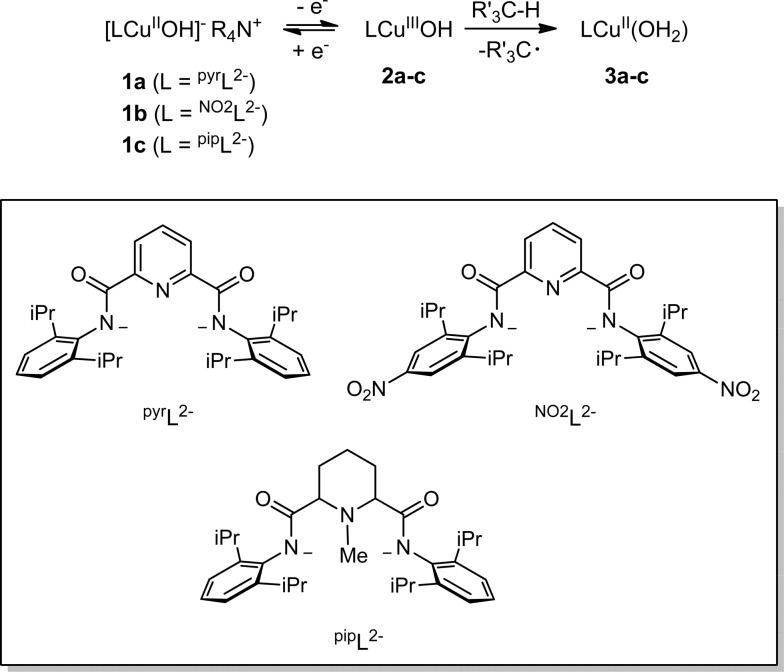
Detailed study of the structural and spectroscopic properties and reactivity of copper–oxygen complexes can provide important insights into the nature of putative intermediates in oxidation catalysis.1 We recently identified a new copper–oxygen motif comprising a [CuOH]2+ core, examples of which (2a–c) were prepared in solution via the one-electron oxidation of anionic copper(ii)-hydroxide complexes 1a–c at low temperature (Scheme 1).1f,2 Complexes 2a–c were postulated on the basis of spectroscopy and theory to be best described as copper(iii)-hydroxide species, and may be viewed formally as protonated versions of the [CuO]+ unit that has been characterized in the gas phase3 and by theory.4,3b,3d Despite their weak oxidizing ability (2a: E 1/2 = –0.074 V vs. Fc+/Fc in THF), the complexes react rapidly with C–H bonds of added organic substrates; for example, dihydroanthracene (DHA) is converted cleanly to anthracene at high rates (e.g. for 2a, k = 1.1(1) M–1 s–1 at –80 °C in CH2Cl2),2c with concomitant formation of the respective copper(ii)-aqua complex (3a–c). The O–H bond dissociation enthalpies (BDE) in 3a–c were experimentally determined to lie in the range 88–91 kcal mol–1,2b,c high values that rationalize, at least in part, the fast rates of reactions of 2a–c with DHA and the observation that even stronger C–H bonds may be attacked, including those of cyclohexane (C–H BDE ∼99 kcal mol–1). The high O–H BDE values for 3a–c arise from high basicity of the hydroxide (pK a (3a) = 18.8 ± 1.8 in THF)2b offsetting the poor oxidizing power of the complexes, properties which may be traced to the strongly electron donating bis(carboxamido) supporting ligands. Kinetics data and computations support the notion that the reactions of 2a–c with organic substrates involve hydrogen atom transfer (HAT) from organic substrates to the [CuOH]2+ unit with a significant tunneling contribution to the reaction rate.2c The rate of HAT from DHA is fastest for 2b, which has a slightly higher O–H BDE in the corresponding reaction product (3b) as a result of a higher reduction potential that offsets its weaker basicity.2c Importantly, the observed high reactivity of the copper(iii)-hydroxide core in 2a–c provides key precedence for its possible involvement as an intermediate in oxidation catalysis.
Scheme 1. Synthesis and reactivity of copper(iii)-hydroxo complexes.
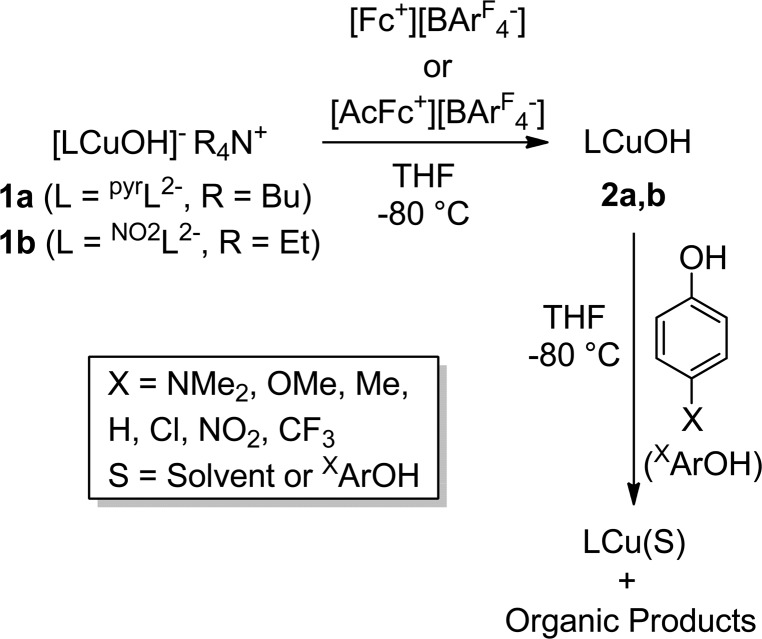
The extent of coupling of the proton and electron for a HAT reaction involved in attack at X–H (X = C, N, O) bonds by transition metal oxo/hydroxo species is a fundamentally important mechanistic issue, particularly in view of the significance of atom transfer reactions in biology and catalysis.5 Two extremes may be envisioned: concerted proton–electron transfer (CPET) or sequential proton and electron transfer (PT/ET or ET/PT depending on which occurs first). For reactions with C–H bonds of substrates that are relatively difficult to oxidize (remove electrons) or deprotonate, the sequential processes are disfavored and tightly coupled, or CPET paths are typical (although there are exceptions).6 A CPET mechanism is consistent with the available evidence for the reactions of the copper(iii)-hydroxide complexes 2a–c with C–H bonds.2 We hypothesized, however, that the high basicity of the hydroxide ligands in these complexes might underlie some contributions from PT/ET processes in reactions with more acidic N–H or O–H bonds. In order to test this notion, we chose to examine the reactivity of 2a and b with phenols, substrates that have garnered extensive attention because of their importance in biological proton, electron, and atom transfer processes.7 By varying the para substituents on the phenols, the reduction potentials and acidity of the phenols could be varied over a significant range (Scheme 2 and Table 1), enabling these effects on the reaction rates to be evaluated for the two complexes 2a and b, that have different O–H BDE's (in the corresponding copper(ii)-aqua complexes 3a and 3b) and DHA reaction rates.2c Herein we report the results of these reactivity studies, and in particular the findings from kinetics experiments that implicate CPET processes for all but the most acidic phenol substrates, for which evidence is provided that PT/ET is involved. The results expand upon previous work2 defining the kinetics and thermodynamics of reactions of the [CuOH]2+ unit that is important for understanding its potential involvement in oxidation catalysis.
Scheme 2. Reactions studied in this work.
Table 1. Properties of phenols XArOH a .
Results
Stopped-flow kinetics experiments
The reactions of the copper(iii)-hydroxide complexes 2a and b with phenols XArOH were monitored using double-mixing stopped-flow UV-vis spectroscopy at –80 °C in THF. In a typical experiment, in the first mixing event equimolar solutions of the copper(ii)-hydroxide complex (1a or b) were combined in a 1 : 1 ratio with the appropriate oxidant in THF ([Fc][BArF 4] in the case of 1a; [AcFc][BArF 4] in the case of 1b). The solution was then aged (4 s for 1a and 0.1 s for 1b) to ensure complete oxidation to 2a or b, respectively, which was verified independently from single mixing experiments and the appearance of the diagnostic ligand-to-metal charge transfer (LMCT) feature associated with the [CuOH]2+ core (λ max, nm (ε, M–1 cm–1) = 548 (10 000) or 500 (13 300) for 2a or b, respectively). In the subsequent second mixing event, the aged solution of 2a or b was combined with a solution of the phenol substrate, and the rapid decay of the LMCT band of 2a or b was monitored.
Reactions with phenols XArOH with X = NMe2, OMe, Me, H, and Cl
For the reactions starting with 2a, both stoichiometric (1 eq. of XArOH relative to 2a) and pseudo first-order conditions (5–100 eq. of XArOH relative to 2a) were used, except in the case for NMe2ArOH, the reactions with which were exceptionally fast and could be monitored only under stoichiometric conditions. Most of the reactions of phenols with compound 2b were too rapid to be measured with excess substrate, so they were measured under stoichiometric conditions. Representative UV-vis spectra as a function of time are shown in Fig. 1. For the pseudo first-order reactions performed with excess substrate, decay traces of the absorbance at a single wavelength (548 nm) generally fit well to a single exponential decay function, consistent with a first-order decay process involving a single kinetic step (Fig. S1†). These results were corroborated by multi-wavelength global analysis,10 which yielded k obs values in excellent agreement with those determined by the single-wavelength analysis (within 10% deviation). Plots of k obs versus [XArOH]0 were then fit to a linear regression, revealing an excellent linear dependence, and the slopes of these fits were taken as the second-order rate constants (k) for the reactions (Table S1, Fig. S2–S4†). For the stoichiometric (1 : 1) runs, k values were determined using the method of initial rates. The initial 5–10% of each concentration vs. time profile was fit by linear regression analysis to obtain an initial reaction rate, which was then divided by the square of the initial concentration of the copper complex to obtain the second-order rate constant (Table S2, Fig. S5–S7, and eqn (S3)†). In all cases, these rate constants obtained for reactions with 2a were within error of those obtained from the pseudo first-order experiments described above, lending credence to the use of this method for all of the reactions of 2b. Average values of the rate constants are summarized in Table 2.
Fig. 1. Representative UV-vis spectra as a function of time (1 ms to 5 s) for the reaction of 2a with MeArOH (5 equiv.) at –80 °C in THF. Only selected data shown here for clarity; all data are shown in Fig. S1.† .
Table 2. Second order rate constants (k) for the reactions of 2a and b with XArOH at –80 °C a .
| X | 2a (THF) b | 2b (THF) c |
| NMe2 | (1.9 ± 0.3) × 106 c | (6.7 ± 1.0) × 106 |
| OMe | (3.0 ± 0.5) × 105 | (1.8 ± 0.3) × 106 |
| Me | (8.9 ± 1.3) × 103 | (1.0 ± 0.2) × 106 |
| H | (3.9 ± 0.6) × 102 | (1.8 ± 0.3) × 105 |
| Cl | (6.5 ± 1.0) × 102 | (1.4 ± 0.2) × 105 |
| NO2 | (2.6 ± 0.4) × 102 d | (8.2 ± 2.6) × 102 |
| CF3 | (3.0 ± 0.5) × 101 d | (3.0 ± 1.5) × 102 |
aAll values in units M–1 s–1. In all cases, uncertainties are taken as 15% (resulting from the propagation of maximum possible errors of 10% each for the concentrations of the two compounds) or as the standard error, whichever is greater.
bValues determined from the pseudo-first order analysis for all reactions except for that for X = NMe2, in which case the rate constant from the stoichiometric analysis was used. See text for details.
cDetermined from the method of initial rates for X = NMe2, OMe, Me, H, and Cl; for X = NO2 and CF3, determined from the mixed first- and second-order fits (eqn (S6) see ESI). See text for details.
dDetermined from single-wavelength analysis. See text for details.
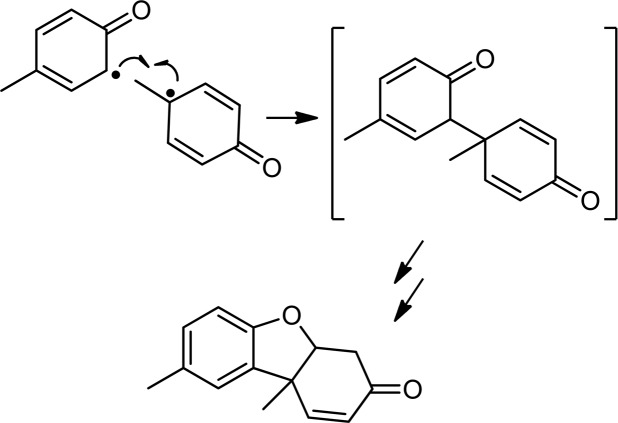
Based on the related reactivity with C–H bonds,2b,c the reactions of 2a and b with phenols XArOH (X = NMe2, OMe, Me, H, and Cl) very likely yield the respective phenoxyl radicals,11 which would be expected to undergo subsequent radical coupling reactions. Attempts to identify such products from batch reactions were only successful in the case of the reactions of 2a and b with MeArOH; Pummerer's ketone12 was identified by GC/MS in approximately 35 and 16% yield, respectively (Scheme 3; see ESI for details†). We can only speculate that our inability to identify radical coupling products from the reactions with the other phenols is due to their decay via a variety of pathways, as has been suggested in related studies.13 Further corroboration of phenoxyl radical generation came from EPR spectroscopic analysis of the product mixtures after reaction of TEMPOH and 2,4,6-tri-t-butylphenol with 2a and b; signals due to the respective nitroxyl and phenoxyl radicals were observed (Fig. S8†). Quantification of the latter by UV-vis spectroscopy indicated an ∼80% yield for reaction with 2a (Fig. S9†).14 Additionally, the inorganic decay product in all of the reactions with 2a, except in the case of NMe2ArOH, is the corresponding copper(ii)-THF adduct formed as a result of ligand exchange of the coordinated water in 3a with the THF solvent. This phenomenon has been described in detail previously2b and is further corroborated in these cases by comparison with the UV-vis absorption features of the copper(ii)-THF adduct (Fig. S10†). The UV-vis decay spectra for reactions with 2b are distinct from any of the known complexes with this ligand and we can only speculate that the product mixtures for these reactions likely contain some mixture of LCu(S) species, where S = H2O, THF, or XArOH. In the case of reactions between 2a/b and NMe2ArOH, the final decay spectra are distinctly different from those of the other phenols in that there is a charge transfer feature in the NIR region (Fig. S11†). This feature is stable at –80 °C, and in the case of reactions with 2b, even persists to some extent after sitting at room temperature overnight. While the identity of this species is under further investigation, we tentatively assign it as some sort of copper-based phenoxyl adduct on the basis of previous reports of similar copper(ii)-phenoxyl complexes15 and the known enhanced stability of the NMe2ArO˙ phenoxyl radical in comparison to the other phenoxyl radicals.16
Scheme 3. Formation of Pummerer's ketone from ortho–para coupling of two p-cresol phenoxyl radicals (only one resonance form of each of the reacting radicals is shown).
Reactions with phenols XArOH with X = NO2 and CF3
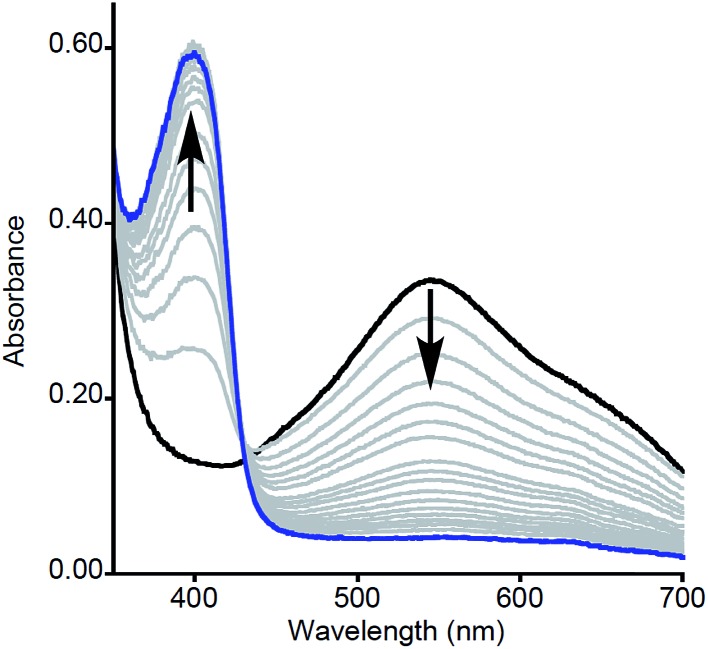
The reactions of 2a and b with CF3ArOH and NO2ArOH differed from those with the other phenols with respect to kinetic behavior and product(s). For reactions of 2a with CF3ArOH and NO2ArOH under pseudo-first order conditions (excess substrate), satisfactory single exponential fits could be obtained for the decay traces at 548 nm. Plotting k obs vs. [XArOH]0 revealed a linear dependence that enabled determination of the second order rate constant (Fig. S2†). In addition, however, in the reaction with NO2ArOH a new feature at 400 nm appeared concomitant with the decay of the LMCT feature for 2a at 548 nm (Fig. 2). Single-wavelength analysis of the growth of the 400 nm feature revealed a second-order rate constant identical to that for the decay of 2a (Fig. S12†). Thus, we assign the species giving rise to the 400 nm band as a reaction product that forms at the same rate as consumption of 2a. We tentatively assign the reaction product as the phenolate (NO2ArO–) on the basis of the close similarity of the 400 nm feature to that independently measured for a sample of (Bu4N)(NO2ArO) dissolved in THF (Fig. S13†), and approximate the yield of NO2ArO– to be ∼55% with respect to the starting copper concentration.17 We suspect that this product is also formed upon reaction of 2b with NO2ArOH, albeit in a much smaller amount, but were unable to verify this because of overlapping features in the UV-vis spectra that obfuscated the 400 nm band (Fig. S14†).18 Given the observation of NO2ArO– as a product, we suspected a possible contribution from a more complicated kinetic model for the reaction of 2a with NO2ArOH that might become evident using multicomponent global analyses. Indeed, the full UV-vis kinetic data for the reactions of 2a with NO2ArOH and CF3ArOH could be satisfactorily fit using multicomponent analyses to a stepwise kinetic model involving the formation of an intermediate (A → B → C) (Fig. S15–S18†). This fit is statistically improved relative to the simpler single-step fit applicable to the reactions of the other phenol substrates, supporting differing mechanisms. We address this issue in further detail below.
Fig. 2. Representative UV-vis spectra as a function of time (1 ms to 100 s) for the reaction of 2a (prepared by reaction of 1a with [Fc][BArF 4]) with NO2ArOH (5 equiv.). Only selected data shown for clarity.
For reactions of 2a with CF3ArOH and NO2ArOH under stoichiometric conditions (equimolar reactant and substrate), competing reaction of 2a with solvent THF complicated the analysis. Thus, while satisfactory fits to the single wavelength data for these reactions could be obtained using the initial rates method, we observed that the second order rate constant from this analysis was significantly higher than that obtained from the pseudo-first order analysis described above. We hypothesized that the rate of decay of 2a in the stoichiometric reactions was enhanced by an added component: attack at the C–H bonds of THF (a phenomenon described previously).2b,19 Equations that model this additional pathway by incorporating an added first-order self-decay component were used to fit the data (eqn (S6)†). These fits yielded second-order rate constants in good agreement with those determined from the pseudo-first order analyses above (Fig. S19 and S20†), thus validating the model that includes the self-decay (THF attack) process. Additionally, the rates of THF activation obtained from these fits are in good agreement with the independently measured self-decay rates of 2a and b in THF, which further corroborates the use of this additional kinetic pathway.
As in the case of the more electron rich phenols discussed above, distinct phenolic oxidation products, including the expected C–C coupled species, could not be identified in the product mixtures for the reactions with either 2a or b. Again, this is likely due to a variety of complicated decay pathways, which is further convoluted in these cases owing to comparable rates of self-decay for 2a or b. However, in contrast to reactions with the more electron rich derivatives, reactions of NO2ArOH and CF3ArOH gave final UV-vis spectra distinct from that of the LCu(THF) species as described before and shown in Fig. S10.† We attribute this difference to the potential formation of other copper(ii)-based products in these cases, such as, for example, copper(ii)-phenoxide/phenol adducts. More interestingly, for the reactions of both substrates with 2a, a conspicuous absorption feature is observed in the approximate range of 625–630 nm. This absorption feature is in good agreement with that for Fc+ (λ max(ε) = 623 nm (1000 M–1 cm–1); see Fig. S21 and S22†), the oxidant used to generate 2a from 1a. This curious observation suggests that Fc+ is somehow regenerated in these reactions. We evaluate the implications of these observations in the discussion section below.
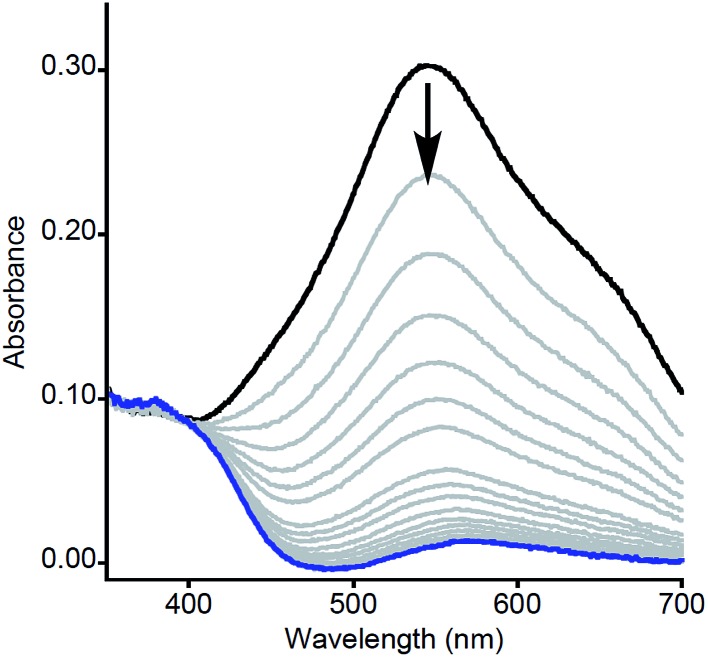
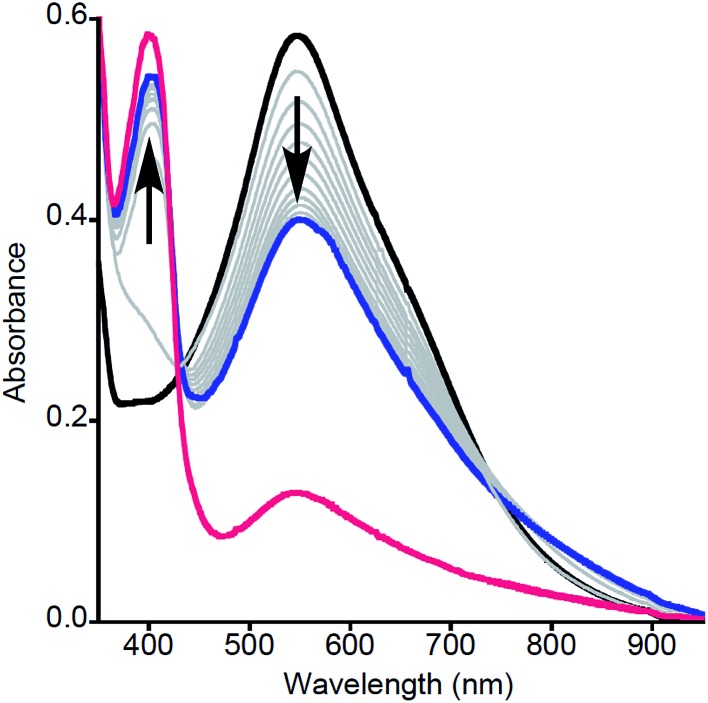
Particularly intriguing was the putative formation of NO2ArO– as a product of the reaction between 2a and NO2ArOH, and we sought to investigate this further. One possible pathway for phenolate formation could be the reduction of NO2ArO˙ by ferrocene, present in solution from the initial oxidation of 1a. However, the potential involvement of an intermediate as suggested from kinetic modeling led us to pursue the alternate possibility of phenolate formation from the deprotonation of NO2ArOH by 2a, which would generate a [LCuOH2]+ species (4a) that could also be reduced by the ferrocene present in the reaction mixture (to yield Fc+). Indeed, the feature at ∼625 nm in the product UV-vis spectrum of this reaction, as well as signals in the product EPR spectrum at g = 4.32, 2.04, and 1.54, corroborate the presence of Fc+ (Fig. S22†).20 Attempts to quantify the Fc+ under these dilute reaction conditions were complicated by the presence of overlapping features; however, analysis of product mixtures for reactions run at higher concentrations ([LCuIIIOH]0 = 0.5 mM) indicate that approximately 90% of the Fc+ is recovered (see Fig. S23†). To further probe these hypotheses, we repeated the reactions using stronger oxidants, namely tri-p-tolylamminium radical-cation [(p-tolyl)3N+˙] (E 1/2 = 0.38 V vs. Fc+/Fc) and thianthrenium radical cation [C12H8S2 +˙] (E 1/2 = 0.86 V vs. Fc+/Fc), the reduced forms of which would not be able to reduce the formed phenoxyl radical or 4a. Treatment of a THF solution of 1a with 1 eq. of [(p-tolyl)3N]PF6 or [C12H8S2]PF6 (dissolved in acetonitrile for solubility/stability purposes) at –80 °C led to the growth of the typical feature at 548 nm associated with formation of 2a (Fig. 3, black spectrum). Upon addition of NO2ArOH (5 equiv.) to this solution, the absorption feature at 400 nm associated with NO2ArO– still appeared and the characteristic LMCT feature for 2a decreased in intensity and shifted slightly (λ max = 550 nm, Fig. 3, blue spectrum). This spectroscopic feature was stable for minutes upon standing at –80 °C, but bleached upon warming to room temperature (Fig. 3, red spectrum), consistent with it being associated with a reactive intermediate. It is noteworthy that the feature at 400 nm is lower in intensity when compared to the experiments using Fc+ as the oxidant; the yield of NO2ArO– can be approximated to be ∼30% with respect to the starting copper concentration. Taken together, all of these observations support the hypothesis that the reduced ferrocene, present in the reaction mixture (from the initial oxidation of 1a) is involved in subsequent reactions.
Fig. 3. UV-vis spectra for the reaction of 2a (prepared by reaction of 1a with (p-tolyl)3N+˙) with NO2ArOH in THF at –80 °C. (Black) Initial spectrum of 2a. (Grey) Intermediate spectra as a function of time (4–834 s). (Blue) Final spectrum stable at –80 °C. (Red) Spectrum resulting from warming to room temperature.
Additional experiments were performed to further evaluate the nature of the intermediate involved in the reaction of 2a with NO2ArOH. To test for the feasibility of the intermediacy of 4a, a solution of 2a (generated by reaction of 1a with [C12H8S2]PF6 in THF at –80 °C) was treated with the weak acid 2,4,6-trimethylpyridnium triflate (Fig. S24, left†). The resulting UV-vis spectrum was similar to that shown in Fig. 3 (blue). An analogous spectrum was also obtained upon reaction of LCu(THF) dissolved in wet acetone or THF (conditions known to yield 3a)2 with [C12H8S2]PF6 at –80 °C (Fig. S24, right and Fig. S28, right†), again consistent with the intermediate being 4a. Alternatively, it is possible that [LCu(THF)]+, formed as a result of a ligand exchange with the solvent, could be present in the above reactions. To evaluate this possibility, we reacted LCu(THF) in anhydrous THF with [C12H8S2]PF6 at –80 °C. In this case, however, the UV-vis spectrum of the resulting solution differed significantly from that in Fig. 3 (Fig. S25;† the identity of this new species is currently under investigation). A third possibility is that the intermediate is the complex LCu(NO2ArO), formed by ligand exchange with NO2ArO–. To evaluate this hypothesis, we prepared (Bu4N)[LCu(NO2ArO)] independently, characterized it fully (including by X-ray crystallography; Fig. S26†), and treated a solution of it in THF with [(p-tolyl)3N]PF6 at –80 °C. The results ruled out LCu(NO2OAr) as the intermediate, as the UV-vis spectrum of the resulting solution also differed from that shown in Fig. 3 (Fig. S27;† the identity of this oxidized species is also under investigation).
Discussion
Kinetics data and control experiments
Second order rate constants for the reactions of the copper(iii)-hydroxide complexes 2a/b with a range of phenols were determined using low temperature stopped-flow methods (Table 2). With the same phenol, k values for reactions of 2b were 3.5–460 times greater than those of 2a. Significant rate differences were previously observed for reactions of 2a and b with C–H bonds, and were attributed to the higher BDE for the O–H bond formed in the product copper(ii)-aqua complex 3b compared to that of 3a.2c For each complex, k values over the range of phenols were found to vary by 4–5 orders of magnitude as a function of para-substituents (Table 2) and for runs with the more electron-rich phenols (X = NMe2, OMe, Me, H, and Cl), the data fit well to a kinetic model involving a single-step (A → B).
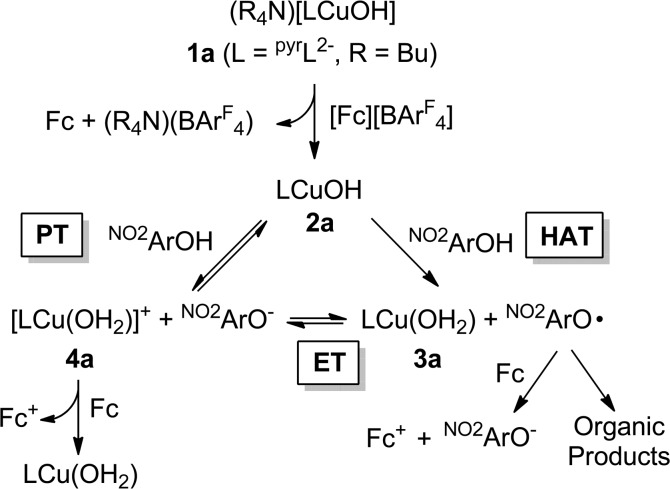
However, the data obtained for reactions between 2a and the most electron-deficient phenols (X = NO2, CF3) were more accurately modelled using a mechanism involving an intermediate species (A → B → C). Coupled with the clear observation of NO2ArO– as a product in reactions between 2a and NO2ArOH, these results suggest a more complicated pathway compared to what was seen for the more electron-rich phenols. To rationalize the production of NO2ArO–, we considered several possible mechanisms (Scheme 4). Initial HAT (i.e., CPET) could yield the copper(ii)-aqua complex 3a and the phenoxyl radical NO2ArO˙ (“HAT” in Scheme 4). This radical might then undergo reduction by ferrocene (formed in the initial reaction used to generate the reactant 2a) to produce NO2ArO– and Fc+. Alternatively, 3a and NO2ArO˙ might participate in a redox equilibrium to yield the copper(iii)-aqua complex 4a and NO2ArO– (“ET”). While, such an equilibrium seems plausible given the very close E 1/2 values for the NO2ArO˙/NO2ArO– (0.314 V vs. Fc+/Fc)8 and CuIII/CuII couples for the copper(iii)-aqua species (0.345 V vs. Fc+/Fc),2b it is likely that alternate decay pathways for the highly reactive phenoxyl radical21 will drive this equilibrium to the right, and thus the equilibrium concentrations of 4a and NO2ArO– should be miniscule. Alternately, NO2ArO– could also form via direct proton transfer between 2a and NO2ArOH (“PT”). In such a scenario, 4a would now either (a) be reduced by ferrocene present in the reaction mixture or (b) react via the “ET” pathway to form the phenoxyl radical.
Scheme 4. Mechanisms that would yield the phenolate NO2ArO–.
Central to several of the above hypotheses is the involvement of the copper(iii)-aqua species 4a, which had previously only been implicated in cyclic voltammetry experiments.2b We hypothesized that if the quenching of NO2ArO˙ and/or 4a by ferrocene could be avoided, we might be able to observe 4a and thus provide independent evidence in favor of it being a feasible intermediate in the reaction of 2a with NO2ArOH. Indeed, an intermediate displaying UV-vis absorption features reminiscent of reported pyridine-dicarboxamido copper(iii)-complexes2 was observed when oxidants stronger than Fc+ (e.g. [(p-tolyl)3N]PF6 or [C12H8S2]PF6) were used. Additionally, these reactions also yielded NO2ArO–, albeit in slightly lower yields when compared to the Fc+ reactions (30% versus 55%). While the detailed kinetic modeling of these reactions using the stronger oxidants proved complicated, we do note that the observed rate constant (k obs) for the growth of the 400 nm feature is essentially identical when either Fc+ or (tolyl)3N+˙ is used as the initial oxidant (Fig. S29†). These observations support the notion that the most plausible intermediate would be 4a formed via direct proton transfer between 2a and NO2ArOH. Moreover, a number of control experiments ruled out other reasonable intermediates like [LCu(THF)]+ or LCu(NO2ArO), which were considered on the basis of known ligand exchange chemistry of 3a.2b More importantly, independent experiments aimed at characterizing 4a using UV-vis spectroscopy via either direct oxidation of 3a or protonation of 2a, yielded a charge-transfer feature at ∼550 nm closely resembling that observed in the intermediate.22 It is also noteworthy that the UV-vis spectrum of the intermediate extracted from the kinetic modelling using multi-component global fitting agrees well with the independent spectra for 4a (Fig. S28†). We also considered the possibility that this intermediate could be due to the formation of some kind of precursor complex between 2a and NO2ArOH. Such species have been implicated in a number of transition metal based oxidations of phenols, often as a rationale for observed saturation behavior in these systems.23 However, we view this idea to be unlikely on the basis of (a) the formation of NO2ArO– concomitant with formation of the intermediate, (b) the persistence of the intermediate, and (c) thermodynamic arguments (presented below).
Taken together, the more complex kinetic model required to fit the data and the direct spectroscopic observations of the intermediate in independent reactions supports the feasibility of copper(iii)-aqua adduct 4a as the intermediate in reactions of 2a with NO2ArOH. This conclusion is not undermined by the fact that when Fc+ is used as an oxidant to generate 2a, the spectroscopic features associated with 4a are not observed upon subsequent reaction with NO2ArOH; the absence of said features may be rationalized by postulating that 4a is reduced in situ by ferrocene present in the reaction mixture. This postulate is supported by identification of Fc+ in the UV-vis and EPR spectra of the product mixtures and the known reduction potential of the 4a/3a couple in THF (E 1/2 = 0.345 V vs. Fc+/Fc).2b
Also in favor of an initial proton transfer step being involved for the acidic phenols is the fact that Fc+ is regenerated in the reactions between 2a and CF3ArOH at high substrate concentrations. Given that the approximate pK a difference (ΔpK a) between 4a and CF3ArOH is 3.5, proton transfer would be expected to be significant only at high concentrations of CF3ArOH, consequently leading to the regeneration of Fc+ only under such circumstances. It is also noteworthy that control reactions with MeArOH as substrate and using [(p-tolyl)3N]PF6 or [C12H8S2]PF6 as the oxidant did not yield any observable intermediate; instead, the features of 2a decayed rapidly as was observed in the stopped-flow studies (Fig. S30†). All the data support the hypothesis that the reactions of 2a with NO2ArOH and CF3ArOH proceed through a different mechanism when compared to the other phenols, which is further explored in thermodynamic arguments below.
For the reactions of 2b with NO2ArOH, the evidence in favor of a divergent mechanism is less clear. In these reactions, data indicating the formation of NO2ArO–, regeneration of AcFc+, and the presence of an intermediate are all lacking. The lack of evidence for aqua adduct 4b may derive from the decreased basicity of 2b relative to 2a (∼2 pK a units).2c This decreased propensity for proton transfer from NO2ArOH to 2b would be offset by a slightly increased thermodynamic driving force for CPET. Thus, while the proton transfer might indeed be induced at higher substrate concentrations (as is suggested for the reaction between 2a and CF3ArOH), its overall contribution in altering the mechanism of the reaction cannot be established unambiguously. Nonetheless, on the basis of the linear free energy plots discussed below, we hypothesize that the reaction between 2b and NO2ArOH might also involve initial proton transfer.
Thermodynamic considerations
Because the thermodynamic data (pK a, E 1/2, BDFE) for the phenols were obtained in DMSO8,9 (Table 1) and no such data is available in THF (the solvent used to acquire the kinetic data for the reactions of 2a and b with the phenols) we sought to convert rate constants measured in THF to the corresponding values in DMSO. Solvent effects on HAT reactions from phenols in a variety of solvents have been examined previously, and an empirical equation was developed that correlates the rates of such reactions across different solvents (eqn (1)).24 In this equation, (i) k S(ArOH/X) denotes the HAT rate constant for reaction of the phenol (ArOH) with a reagent X in a given solvent S, (ii) k o(ArOH/X) denotes the HAT rate constant in an alkane solvent and is unique to the particular reactant pair, (iii) βH2 (unique to solvent S) represents a general thermodynamically related scale of hydrogen-bond acceptor abilities for different solvents in CCl4, and (iv) αH2 (unique to phenol ArOH) represents a general thermodynamically related scale of phenol hydrogen bond donor strength. Using reported values of αH2 (Table S3†) and βH2 (0.51 for THF and 0.78 for DMSO),25 we subtracted forms of eqn (1) (one for THF and one for DMSO) and included the βH2 values to yield eqn (2). The rate constants in DMSO26 were then calculated using eqn (2); these are listed below in Table 3.
 |
1 |
| log kDMSO = log kTHF – 2.241αH2 | 2 |
Table 3. Second order rate constants (k) for the reactions of 2a and b with XArOH at –80 °C, converted from THF to DMSO a .
| X | 2a (DMSO) b | 2b (DMSO) b |
| NMe2 | 1.0 × 10⁵ | 3.5 × 10⁵ |
| OMe | 1.6 × 10⁴ | 9.4 × 10⁴ |
| Me | 4.7 × 10² | 5.3 × 10⁴ |
| H | 1.8 × 101 | 8.3 × 10³ |
| Cl | 2.0 × 101 | 4.4 × 10³ |
| NO2 | 4.5 × 100 | 1.4 × 101 |
| CF3 | 7.2 × 10⁻¹ | 7.0 × 100 |
aAll values in units M–1 s–1.
bEstimated from the experimental values in THF (Table 2) using an empirical correlation of phenol rate constants with solvent hydrogen bonding properties (eqn (1) and (2); see text). Given that the uncertainties in α and β are unknown, no uncertainties are reported for the DMSO values.
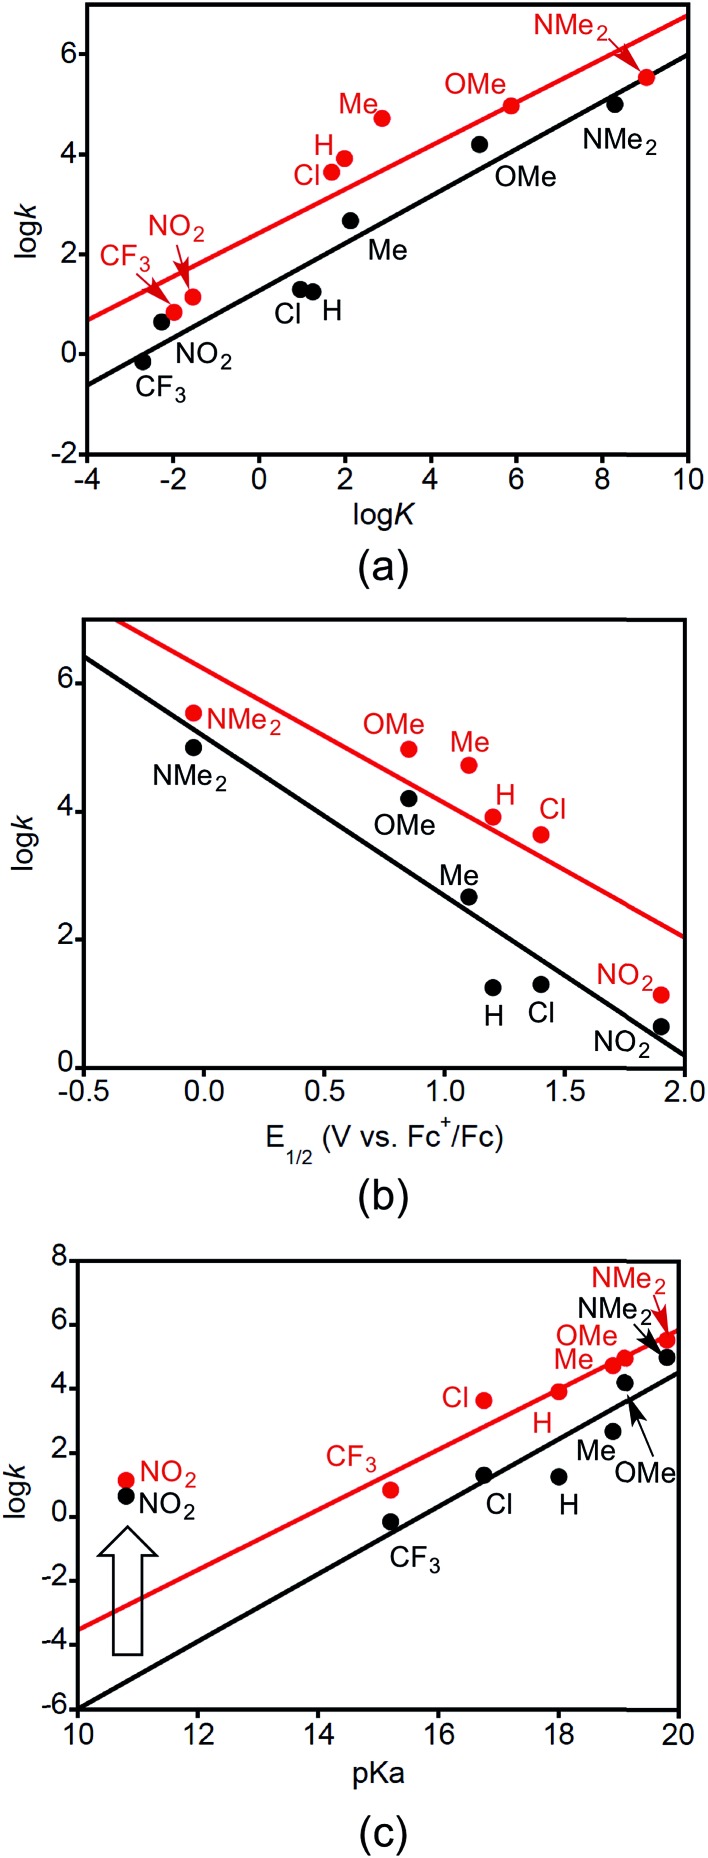
Plots of log k DMSO versus log K, E 1/2, and pK a are shown in Fig. 4. Here k is the second order rate constant of the reaction in DMSO (from Table 3), E 1/2 is the reduction potential of the XArOH in DMSO (E 1/2(ROH+˙/ROH) in Table 1), and pK a is for the phenol in DMSO (Table 1). The equilibrium constant K is for the reaction between 2a or b with the phenol XArOH to form 3a or b and the phenoxyl radical XArO˙, and was determined from the approximate ΔG CPET (defined as the difference in the bond dissociation free energy for the phenol O–H and the BDE of the corresponding copper(ii)-aqua complex) at T = 298 K.
Fig. 4. (a) Plots of log k DMSO vs. log K CPET for reactions of 2a (black) and 2b (red) with phenols XArOH (X labeled). Linear fits have slopes of 0.47 (R 2 = 0.94) and 0.44 (R 2 = 0.84), respectively. (b) Plots of log k DMSO vs. E 1/2(XArOH+˙/XArOH) (X indicated) for their reactions with 2a (black) and 2b (red). The point for CF3ArOH is not included as the corresponding E 1/2 is not known. Linear fits have slopes of –2.5 (R 2 = 0.84) and –2.1 (R 2 = 0.76), respectively. (c) Plots of log k DMSO vs. pK a of the phenols XArOH (X indicated) for their reactions with 2a (black) and 2b (red). Linear fits do not include the data points for X = NO2 and have slopes of 1.1 (R 2 = 0.85) and 0.94 (R 2 = 0.93), respectively. The wide arrow indicates the X = NO2 outliers.
The linear correlation between log k and log K (Fig. 4a) seems to support a similar mechanism operating across all the phenol substrates. The unitless slope of 0.47 and 0.44 for this Brønsted-type plot shows that an increase of K CPET of 102 gives an increase in k CPET of roughly 10, with the value of roughly 1/2 being consistent with a relationship between driving force and kinetic barrier that is within the typical low-driving force Marcus regime (ΔG° ≪ 2λ) and is in line with what has been observed for other cases of PCET.24d,27 The plots of log k vs. E 1/2(XArOH+˙/XArOH) (Fig. 4b) may also be fit to straight lines, although the fits are of lower quality, with slopes of –2.5 V–1 (R 2 = 0.84) and –2.1 V–1 (R 2 = 0.76). Converting from relative reduction potentials to relative equilibrium constants for ET from XArOH to 2a or b (alternately viewed as slopes of the linear fits to (RT/F)ln k vs. E 1/2 plots, as depicted in Fig. S31†) gives respective unitless slopes of 0.17 and 0.12, which reflect that these reactions are not very sensitive to the reduction potential of the phenols. The slope of the plot of log k vs. phenol pK a (Fig. 4c, with linearity only achieved by omitting the data point for X = NO2) is unusual. Even though the reactions involve removal of the phenolic proton, the more acidic phenols in general react slower. For example, NMe2ArOH is 3 orders of magnitude less acidic than ClArOH, but it reacts 5000 and 800 times faster for 2a and b, respectively. Thus the Brønsted plot has a positive slope, of 1.1. This rules out an initial proton-transfer step for these phenols, as this would have more acidic phenols reacting faster. The points for X = NO2 are anomalous in the plots of log k vs. pK a (Fig. 4c). The rate constants for reactions with this phenol are significantly faster—by >4 orders of magnitude—than that predicted by the linear dependence displayed by the other substrates. Interestingly, and in contrast to what we observe, in the case of other examples for which a consistent CPET mechanism was established, plots of log k vs. pK a, E 1/2, and BDFE all displayed good linear correlations across all substrates.13,28
We interpret the data presented in Fig. 4 to indicate that while a common CPET mechanism is followed by most of the phenols, for the most acidic phenol with X = NO2, initial proton transfer followed by a subsequent electron transfer (PT/ET) likely occurs competitively with the CPET pathway.6c,29 The observation of the aquo complex 4a as an intermediate shows that CPET is not the only process occurring for this phenol. Still, the fact that the rate constant for the reaction shows a good linear correlation with the driving force for a CPET reaction (Fig. 4a) is intriguing and suggests that the reaction likely proceeds by both pathways at similar rates. Detailed kinetic modeling is complicated by the involvement of the reduced form of the initial ferrocenium oxidant, with some of the phenoxyl radical apparently generated via a CPET mechanism being reduced by Fc, thus increasing the apparent yield of the phenolate. The higher yields of NO2ArO– when Fc+ is used as an oxidant are consistent with this notion. For the stronger oxidants however, any phenolate formed is probably from the initial PT pathway in the PT/ET mechanism.
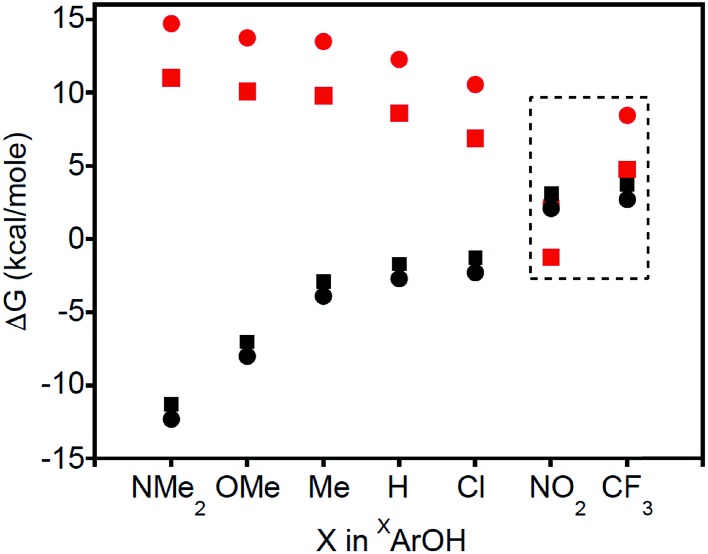
Thermodynamic arguments also support the possibility for PT in the reactions of XArOH (X = NO2 and CF3), comparing the free energies for PT and CPET as a function of the X substituent in XArOH (Fig. 5). ΔG CPET is estimated as the difference of the phenol BDFE and the BDE of the copper(ii)-aqua complex, 3a. ΔG PT is roughly approximated as the difference of the phenol pK a in DMSO and the pK a of the copper(iii)-aqua complex 3a in THF, which should capture the trend (the various phenol pK as likely being shifted by a constant amount between DMSO and THF) and should be more negative than the true value in THF (the less polar solvent disfavoring the formation of charged species in the equilibrium ArOH + LCuOH ⇋ ArO– + LCuOH2 +). Fig. 5 shows that ΔG PT is greater than ΔG CPET by a significant amount for most of the phenols, consistent with CPET being more favorable than the corresponding PT/ET process. However, for X = NO2 and CF3, ΔG PT comes much closer and is likely comparable to ΔG CPET, so PT may be thermodynamically competitive with CPET in these cases.30 It has been suggested that under such circumstances, there can be a change in the nature of the transition state; “valence bond mixing creates a concerted reaction with PT character, followed by ET”.6b In this case, however, competitive pathways are indicated by the appearance of phenoxide and aquo complexes as intermediates, rather than the evolution of a single transition state. Additionally, we note that there is a conspicuous discontinuity in the Hammett plots (log k X/k H is plotted vs. the σ p for the respective para-substituents in XArOH), particularly for X = NO2 and CF3 (Fig. S32†).
Fig. 5. Plot of ΔG for corresponding PT (red) or CPET (black) reactions with 2a (squares) and 2b (circles). The dashed region represents where there is potential for thermodynamic overlap (i.e., both PT and CPET are feasible). Estimated errors in ΔG are ±3 kcal mol–1 (error bars not shown for clarity).
In general, metal-mediated PCET reactions involving initial PT from single donor site to single acceptor site are rare. In one case, manganese(iii)- and iron(iii)-oxo complexes featuring extremely basic oxo ligands were shown to change mechanism from CPET to PT in their reactions with phenols.31 Notably, however, product analysis showed that the subsequent electron transfer after PT did not occur, even with fairly reducing phenolic substrates. Other studies report initial proton transfer occurring in aqueous PCET reactions of substituted phenols at higher pH, but these reactions are often reminiscent of sequential-proton-loss-electron-transfer (SPLET) in which hydroxide (or buffer) serves to deprotonate the phenol prior to one electron oxidation of the phenoxide.32 Still other reports of PT-initiated PCET reactions involving ruthenium(iv)-oxo or osmium(iii)-amino complexes have also been shown to involve exogenous hydroxide as a proton acceptor.33 In such systems it is generally difficult to distinguish between a concerted and sequential process. Most common are examples in which metal-mediated phenol-based oxidations have been shown to proceed via concerted processes. These include reactions mediated by metal-superoxo,34 -oxo,29b,35 and -hydroxo/alkoxo species,23b,36 as well as metal based oxidants featuring pendant basic functionalities, which are often an amine or carboxylate group.23c,37 In some cases an “ET-first” type mechanism has been proposed, as in the case of two μ-peroxo/μ-oxo-dicopper species.13 There are also a number of studies which report a change in mechanism from a concerted process to a sequential ET/PT process, induced by increasing the overall driving force for electron-transfer either by increasing the reduction potential of the H-atom abstractor or by decreasing the oxidation potential of the phenolic substrate.27b,33 In one instance mechanistic changeover has even been induced by simply changing the temperature.38 A unifying theme amongst all of the above examples is that the transition metal based oxidants are supported by neutral/monoanionic ligand frameworks and possess an overall cationic charge. Consequently, the reactive species most commonly behave as electrophiles in these studies, thus precluding pathways involving an initial PT step.
These characteristics contrast with those of 2a, which is a reasonably strong base (estimated pK a ∼11.7 for 4a in THF). By analogy to the above cases in which an “ET-first” mechanism was induced by decreasing the oxidation potential of the phenolic substrate (i.e. making the substrate more electron-rich), we propose that decreasing the pK a of the phenolic substrate (making it more electron-poor) induces a “PT-first” mechanism in the reaction between 2a and NO2ArOH. As an illustration of this point, it is instructive to compare this reaction with that between a ruthenium(iii)-pterin complex and NO2ArOH, which is proposed to proceed via a CPET pathway.23c The thermodynamic driving force for a CPET reaction in both these cases is very similar (BDE of 3a is 90 kcal mol–1 while that for the N–H bond formed in the ruthenium–pterin complex is ∼89 kcal mol–1). However, the ruthenium(iii)–pterin is significantly less basic (pK a ∼ 12 in MeCN) than NO2ArOH (pK a ∼ 20.7 in MeCN),23c which results in an unfavorable thermodynamic driving force for a proton transfer from NO2ArOH in that solvent (∼9 pK a units, ∼12 kcal mol–1). Consequently, the reaction proceeds through the more feasible CPET mechanism. In contrast, the copper(iii)-aqua complex (4a) has a pK a ∼ 11.7 (in THF) so proton transfer to NO2ArOH (pK a ∼ 13.1 in THF)29 is clearly much more energetically favorable, indicating the feasibility of contribution from a PT/ET pathway.
The above argument raises an important question: if the thermodynamic driving force of the CPET pathway is comparable to that for the corresponding PT pathway, what factors determine the contribution from each pathway in the overall mechanism? Computational studies aimed at addressing such a dichotomy between concerted and sequential PT/ET pathways suggest that factors such as intrinsic proton transfer barrier and nature of coupling between the proton and electron are often key determinants under such circumstances.39 While in many cases the CPET pathway is strongly favored, such a mechanistic cross-over seems plausible, particularly in cases where the free energies are competitive and where the proton transfer occurs between electronegative O or N atoms so that the intrinsic barrier is small. For instance, a gas phase study focused on understanding such competition between PT versus HAT in reactions of enol radical cations and aldehydes concluded that when the enthalpies of the PT and HAT (ΔH PT and ΔH HAT, respectively) were similar, the PT pathway dominated. The authors attribute this to a much more stable transition state involving H-bonding in the case of PT and a non-negligible intrinsic barrier in the case of the HAT pathway.40 While this system is significantly different than the solution phase studies discussed above, it serves to highlight the importance of such factors as the nature of the transition state and intrinsic barriers in the phenol reactions of 2a, and in these types of PCET reactions in general.
Summary and conclusions
The reactivity of the copper(iii)-hydroxide complexes 2a and 2b in THF with a series of phenols XArOH with para substituents X having a range of electron donor capabilities was probed using low temperature stopped-flow methods. Second-order rate constants for the reactions were measured and found to vary over a wide range (∼105 M–1 s–1). For X = NMe2, OMe, Me, H, and Cl, direct formation of phenoxyl radical species is implicated, whereas for X = NO2 (and likely for CF3 as well), the phenolate XArO– formed and the kinetics for decay of 2a and 2b were best fit to a model involving the formation of an intermediate identified tentatively on the basis of independent experiments as the copper(iii)-aqua complex 4a. These results, in conjunction with evaluation of the trends in log k as a function of the phenol thermodynamic parameters log K, E 1/2, and pK a are consistent with a CPET mechanism for the series X = NMe2, OMe, Me, H, and Cl, but with an additional contribution from sequential PT/ET for the most acidic phenols with X = NO2 and CF3. These results serve to elucidate the finer nuances of the hydrogen atom abstraction ability of the reactive copper(iii) hydroxide species, particularly highlighting the important role of its basicity in such reactions. More generally, these findings provide significant insights into fundamental aspects of the reactivity of the [CuOH]2+ core, which may play a key role in oxidations promoted by enzymes and other catalysts.
Acknowledgments
We thank the NIH (grant R37GM47365 to W. B. T. and grant 5R01GM050422 to J. M. M.) for financial support. We acknowledge Dr Bradley McKeown for his help with the stopped-flow measurements. X-ray diffraction experiments were performed using a crystal diffractometer acquired through NSF-MRI Award CHE-1229400.
Footnotes
References
- (a) Mirica L. M., Ottenwaelder X., Stack T. D. P. Chem. Rev. 2004;104:1013–1045. doi: 10.1021/cr020632z. [DOI] [PubMed] [Google Scholar]; (b) Lewis E., Tolman W. B. Chem. Rev. 2004;104:1047–1076. doi: 10.1021/cr020633r. [DOI] [PubMed] [Google Scholar]; (c) Lee J. Y., Karlin K. D. Curr. Opin. Chem. Biol. 2015;25:184–193. doi: 10.1016/j.cbpa.2015.02.014. [DOI] [PMC free article] [PubMed] [Google Scholar]; (d) Himes R. A., Karlin K. D. Curr. Opin. Chem. Biol. 2009;13:119–131. doi: 10.1016/j.cbpa.2009.02.025. [DOI] [PMC free article] [PubMed] [Google Scholar]; (e) Itoh S. Acc. Chem. Res. 2015;48:2066–2074. doi: 10.1021/acs.accounts.5b00140. [DOI] [PubMed] [Google Scholar]; (f) Gagnon N., Tolman W. B. Acc. Chem. Res. 2015;48:2126–2131. doi: 10.1021/acs.accounts.5b00169. [DOI] [PMC free article] [PubMed] [Google Scholar]
- (a) Donoghue P. J., Tehranchi J., Cramer C. J., Sarangi R., Solomon E. I., Tolman W. B. J. Am. Chem. Soc. 2011;133:17602–17605. doi: 10.1021/ja207882h. [DOI] [PMC free article] [PubMed] [Google Scholar]; (b) Dhar D., Tolman W. B. J. Am. Chem. Soc. 2015;137:1322–1329. doi: 10.1021/ja512014z. [DOI] [PMC free article] [PubMed] [Google Scholar]; (c) Dhar D., Yee G. M., Spaeth A. D., Boyce D. W., Zhang H., Dereli B., Cramer C. J., Tolman W. B. J. Am. Chem. Soc. 2016;138:356–368. doi: 10.1021/jacs.5b10985. [DOI] [PMC free article] [PubMed] [Google Scholar]
- (a) Rijs N. J., Weiske T., Schlangen M., Schwarz H. Chem. Phys. Lett. 2014;608:408–424. [Google Scholar]; (b) Dietl N., Schlangen M., Schwarz H. Angew. Chem., Int. Ed. 2012;51:5544–5555. doi: 10.1002/anie.201108363. [DOI] [PubMed] [Google Scholar]; (c) Dietl N., van der Linde C., Schlangen M., Beyer M. K., Schwarz H. Angew. Chem., Int. Ed. 2011;50:4966–4969. doi: 10.1002/anie.201100606. [DOI] [PubMed] [Google Scholar]; (d) Schröder D., Holthausen M. C., Schwarz H. J. Phys. Chem. B. 2004;108:14407–14416. [Google Scholar]
- (a) Decker A., Solomon E. I. Curr. Opin. Chem. Biol. 2005;9:152–163. doi: 10.1016/j.cbpa.2005.02.012. [DOI] [PubMed] [Google Scholar]; (b) Kamachi T., Kihara N., Shiota Y., Yoshizawa K. Inorg. Chem. 2005;44:4226–4236. doi: 10.1021/ic048477p. [DOI] [PubMed] [Google Scholar]; (c) Yoshizawa K., Kihara N., Kamachi T., Shiota Y. Inorg. Chem. 2006;45:3034–3041. doi: 10.1021/ic0521168. [DOI] [PubMed] [Google Scholar]; (d) Comba P., Knoppe S., Martin B., Rajaraman G., Rolli C., Shapiro B., Stork T. Chem.–Eur. J. 2008;14:344–357. doi: 10.1002/chem.200700865. [DOI] [PubMed] [Google Scholar]; (e) Kim S., Ståhlberg J., Sandgren M. Proc. Natl. Acad. Sci. U. S. A. 2014;111:149–154. doi: 10.1073/pnas.1316609111. [DOI] [PMC free article] [PubMed] [Google Scholar]
- (a) Warren J. J., Mayer J. M. Biochemistry. 2015;54:1863–1878. doi: 10.1021/acs.biochem.5b00025. [DOI] [PMC free article] [PubMed] [Google Scholar]; (b) Costentin C., Robert M., Savéant J.-M., Tard C. Acc. Chem. Res. 2014;47:271–280. doi: 10.1021/ar4001444. [DOI] [PubMed] [Google Scholar]; (c) Weinberg D. R., Gagliardi C. J., Hull J. F., Murphy C. F., Kent C. A., Westlake B. C., Paul A., Ess D. H., McCafferty D. G., Meyer T. J. Chem. Rev. 2012;112:4016–4093. doi: 10.1021/cr200177j. [DOI] [PubMed] [Google Scholar]; (d) Costentin C., Robert M., Savéant J.-M. Acc. Chem. Res. 2010;43:1019–1029. doi: 10.1021/ar9002812. [DOI] [PubMed] [Google Scholar]; (e) Hammes-Schiffer S. Acc. Chem. Res. 2009;42:1881–1889. doi: 10.1021/ar9001284. [DOI] [PMC free article] [PubMed] [Google Scholar]; (f) Mayer J. M. Annu. Rev. Phys. Chem. 2004;55:363–390. doi: 10.1146/annurev.physchem.55.091602.094446. [DOI] [PubMed] [Google Scholar]
- (a) Borovik A. S. Chem. Soc. Rev. 2011;40:1870–1874. doi: 10.1039/c0cs00165a. [DOI] [PMC free article] [PubMed] [Google Scholar]; (b) Usharani D., Lacy D. C., Borovik A. S., Shaik S. J. Am. Chem. Soc. 2013;135:17090–17104. doi: 10.1021/ja408073m. [DOI] [PMC free article] [PubMed] [Google Scholar]; (c) Morimoto Y., Park J., Suenobu T., Lee Y.-M., Nam W., Fukuzumi S. Inorg. Chem. 2012;51:10025–10036. doi: 10.1021/ic3016723. [DOI] [PubMed] [Google Scholar]
- For example, see: ; (a) Minnihan E. C., Nocera D. G., Stubbe J. Acc. Chem. Res. 2013;46:2524–2535. doi: 10.1021/ar4000407. [DOI] [PMC free article] [PubMed] [Google Scholar]; (b) McEvoy J. P., Brudvig G. W. Chem. Rev. 2006;106:4455–4483. doi: 10.1021/cr0204294. [DOI] [PubMed] [Google Scholar]; (c) Kaila V. R. I., Verkhovsky M. I., Wikström M. Chem. Rev. 2010;110:7062–7081. doi: 10.1021/cr1002003. [DOI] [PubMed] [Google Scholar]; (d) Yoshikawa S., Shimada A. Chem. Rev. 2015;115:1936–1989. doi: 10.1021/cr500266a. [DOI] [PubMed] [Google Scholar]
- Warren J. J., Tronic T. A., Mayer J. M. Chem. Rev. 2010;110:6961–7001. doi: 10.1021/cr100085k. [DOI] [PMC free article] [PubMed] [Google Scholar]
- Bordwell F. G., Cheng J. J. Am. Chem. Soc. 1991;113:1736–1743. [Google Scholar]
- Olis GlobalWorks 3D Analysis Software. For illustrative references see ; (a) Ma Z., Williamson H. R., Davidson V. L. Proc. Natl. Acad. Sci. U. S. A. 2015;112:10896–10901. doi: 10.1073/pnas.1510986112. [DOI] [PMC free article] [PubMed] [Google Scholar]; (b) DeSa R. J., Matheson I. B. C. Methods Enzymol. 2004;384:1–8. doi: 10.1016/S0076-6879(04)84001-1. [DOI] [PubMed] [Google Scholar]; (c) Henry E. R., Hofrichter J. Methods Enzymol. 1992;210:129–192. [Google Scholar]; (d) Sreerama N., Venyaminov S. Y., Woody R. W. Anal. Biochem. 2001;299:271–274. doi: 10.1006/abio.2001.5420. [DOI] [PubMed] [Google Scholar]
- In all cases we assume that the rates measured correspond to the rate of the HAT/CPET reaction between 2a/b and ArOH. It is also possible that the organic product of this reaction could further react with additional equivalents of 2a/b, but we assume here that such secondary reactions are negligible. This possibility is currently under further investigation
- Miller L. L., Stewart R. F. J. Org. Chem. 1978;43:1580–1586. [Google Scholar]
- Osako T., Ohkubo K., Taki M., Tachi Y., Fukuzumi S., Itoh S. J. Am. Chem. Soc. 2003;125:11027–11033. doi: 10.1021/ja029380+. [DOI] [PubMed] [Google Scholar]
- Manner V. W., Markle T. F., Feudenthal J. H., Roth J. P., Mayer J. M. Chem. Commun. 2008:256–258. doi: 10.1039/b712872j. [DOI] [PubMed] [Google Scholar]
- (a) Verma P., Pratt R. S., Storr T., Wasinger E. C., Stack T. D. P. Proc. Natl. Acad. Sci. U. S. A. 2011;108:18600–18605. doi: 10.1073/pnas.1109931108. [DOI] [PMC free article] [PubMed] [Google Scholar]; (b) Jazdzewski B. A., Holland P. L., Pink M., Young V. G., Spencer D. J. E., Tolman W. B. Inorg. Chem. 2001;40:6097–6107. doi: 10.1021/ic010615c. [DOI] [PubMed] [Google Scholar]; (c) Jazdzewski B. A., Tolman W. B. Coord. Chem. Rev. 2000;200–202:633–685. [Google Scholar]
- Eyer P., Lengfelder E. Biochem. Pharmacol. 1984;33:1005–1013. doi: 10.1016/0006-2952(84)90507-0. [DOI] [PubMed] [Google Scholar]
- We note that there is a possibility that the formed nitrophenolate anion might not be present as free phenolate in the reaction mixture and could potentially interact with the copper(ii)-solvato adduct formed in situ to yield a copper(ii)-phenolate complex
- For reactions of 2b with NO2ArOH it is expected that the CT feature corresponding to the NO2ArO– at 400 nm, if present, would be significantly less intense than for reactions of 2a with NO2ArOH, due to (1) the significant contribution from self-decay in THF and (2) the much less favorable thermodynamics for proton transfer
- We hypothesize that this also occurs in the pseudo-first order runs, but is accounted for in the self-decay component of the reaction observed as a non-zero y-intercept in the second order k vs. [XArOH]0 plots, which also agree with the previously measured self-decay rates
- For a representative EPR spectrum of FcBF4 see Bew S. P., Cheesman M. R., Sharma S. V., Chem. Commun., 2008. , 5731 –5733 . [DOI] [PubMed] [Google Scholar]
- Neta P., Grodlowski J. J. Phys. Chem. Ref. Data. 2005;34:109–199. [Google Scholar]
- We note however that there are subtle differences in these independent spectra for 4a and that of the intermediate; particularly in some cases the independent spectra for 4a depict slightly more pronounced shoulder absorption features at ∼830 nm. We attribute these differences to the likely presence of NO2ArO–/NO2ArOH in the latter reaction mixtures
- (a) Mader E. A., Mayer J. M. Inorg. Chem. 2010;49:3685–3687. doi: 10.1021/ic100143s. [DOI] [PMC free article] [PubMed] [Google Scholar]; (b) Wijeratne G. B., Corzine B., Day V. W., Jackson T. A. Inorg. Chem. 2014;53:7622–7634. doi: 10.1021/ic500943k. [DOI] [PubMed] [Google Scholar]; (c) Miyazaki S., Kojima T., Mayer J. M., Fukuzumi S. J. Am. Chem. Soc. 2009;131:11615–11624. doi: 10.1021/ja904386r. [DOI] [PMC free article] [PubMed] [Google Scholar]
- (a) Snelgrove D. W., Lusztyk J., Banks J. T., Mulder P., Ingold K. U. J. Am. Chem. Soc. 2001;123:469–477. [Google Scholar]; (b) Nielsen M. F., Ingold K. U. J. Am. Chem. Soc. 2006;128:1172–1182. doi: 10.1021/ja0548081. [DOI] [PubMed] [Google Scholar]; (c) Litwinienko G., Ingold K. U. Acc. Chem. Res. 2007;40:222–230. doi: 10.1021/ar0682029. [DOI] [PubMed] [Google Scholar]; (d) Warren J. J., Mayer J. M. Proc. Natl. Acad. Sci. U. S. A. 2010;107:5282–5287. doi: 10.1073/pnas.0910347107. [DOI] [PMC free article] [PubMed] [Google Scholar]; (e) Amorati R., Valgimigli L. Org. Biomol. Chem. 2012;10:4147–4158. doi: 10.1039/c2ob25174d. [DOI] [PubMed] [Google Scholar]; (f) Jha M., Pratt D. A. Chem. Commun. 2008:1252–1254. doi: 10.1039/b800369f. [DOI] [PubMed] [Google Scholar]; (g) Valgimigli L., Banks J. T., Ingold K. U., Lusztyk J. J. Am. Chem. Soc. 1995;117:9966–9971. [Google Scholar]
- Abraham M. H., Grellier P. L., Prior D. B., Duce P. P., Morris J. J., Taylor P. J. J. Chem. Soc., Perkin Trans. 2. 1989:699–711. [Google Scholar]
- An implicit assumption made in using these conversions is that the abstractor behaves identically in the two solvents. While Ingold and co-workers have previously demonstrated that such kinetic solvent effects are independent of the nature of the abstractor (ref. 24g), we acknowledge that this might not be completely true for 2a/b, as they could act as potential hydrogen bond donors and behave differently in THF and DMSO. However, this is expected to be a systematic trend for a given abstractor and hence these conversions are useful in predicting trends across their reactions with a series of phenols
- (a) Mayer J. M. Acc. Chem. Res. 2010;44:36–46. doi: 10.1021/ar100093z. [DOI] [PMC free article] [PubMed] [Google Scholar]; (b) Mayer J. M. J. Phys. Chem. Lett. 2011;2:1481–1489. doi: 10.1021/jz200021y. [DOI] [PMC free article] [PubMed] [Google Scholar]
- (a) Nomrowski J., Wenger O. Inorg. Chem. 2015;54:3680–3687. doi: 10.1021/acs.inorgchem.5b00318. [DOI] [PubMed] [Google Scholar]; (b) Kundu S., Micelli E., Farquhar E. R., Ray K. Dalton Trans. 2014;43:4264–4267. doi: 10.1039/c3dt52644e. [DOI] [PMC free article] [PubMed] [Google Scholar]
- (a) Sjödin M., Styring S., Wolpher J., Xu Y., Sun L., Hammarström L. J. Am. Chem. Soc. 2005;127:3855–3863. doi: 10.1021/ja044395o. [DOI] [PubMed] [Google Scholar]; (b) Ohzu S., Ishizuka T., Kotani H., Kojima T. Chem. Commun. 2014;50:15018–15021. doi: 10.1039/c4cc07488b. [DOI] [PubMed] [Google Scholar]
- Consistent with this conclusion, we found the pK a of NO2ArOH in THF to be 13.1 (see Fig. S33 and Table S5), close to the value reported in DMSO (Table 1)
- Gupta R., Borovik A. S. J. Am. Chem. Soc. 2003;125:13234–13242. doi: 10.1021/ja030149l. [DOI] [PubMed] [Google Scholar]
- Costentin C., Louault C., Robert M., Savéant J.-M. Proc. Natl. Acad. Sci. U. S. A. 2009;106:18143–18148. doi: 10.1073/pnas.0910065106. [DOI] [PMC free article] [PubMed] [Google Scholar]
- (a) El-Samanody E.-S., Demadis K. D., Meyer T. J., White P. S. Inorg. Chem. 2001;40:3677–3686. doi: 10.1021/ic000764f. [DOI] [PubMed] [Google Scholar]; (b) Lebeau E. L., Binstead R. A., Meyer T. J. J. Am. Chem. Soc. 2001;123:10535–10544. doi: 10.1021/ja000517a. [DOI] [PubMed] [Google Scholar]
- Lee Y. J., Peterson R. L., Ohkubo K., Garcia-Bosch I., Himes R. A., Woertink J., Moore C. D., Solomon E. I., Fukuzumi S., Karlin K. D. J. Am. Chem. Soc. 2014;136:9925–9937. doi: 10.1021/ja503105b. [DOI] [PMC free article] [PubMed] [Google Scholar]
- Kotani H., Kaida S., Ishizuka T., Sakaguchi M., Ogura T., Shiota Y., Yoshizawa K., Kojima T. Chem. Sci. 2015;6:945–955. doi: 10.1039/c4sc02285h. [DOI] [PMC free article] [PubMed] [Google Scholar]
- Wijeratne G. B., Day V. W., Jackson T. A. Dalton Trans. 2015;44:3295–3306. doi: 10.1039/c4dt03546a. [DOI] [PubMed] [Google Scholar]
- Warren J. J., Mayer J. M. J. Am. Chem. Soc. 2011;133:8544–8551. doi: 10.1021/ja201663p. [DOI] [PMC free article] [PubMed] [Google Scholar]
- Jung J., Kim S., Lee Y.-M., Nam W., Fukuzumi S. Angew. Chem., Int. Ed. 2016;55:7450–7454. doi: 10.1002/anie.201602460. [DOI] [PubMed] [Google Scholar]
- (a) Hammes-Schiffer S., Stuchebrukhov A. A. Chem. Rev. 2010;110:6939–6960. doi: 10.1021/cr1001436. [DOI] [PMC free article] [PubMed] [Google Scholar]; (b) Kretchmer J. S., Miller T. F. Inorg. Chem. 2016;55:1022–1031. doi: 10.1021/acs.inorgchem.5b01821. [DOI] [PubMed] [Google Scholar]
- Audier H.-E., Bouchoux G., Mourgues P., Penaoud-Berruyer F. Org. Mass Spectrom. 1992;27:439–442. [Google Scholar]
Associated Data
This section collects any data citations, data availability statements, or supplementary materials included in this article.


