. 2016 Sep 27;8(2):1075–1085. doi: 10.1039/c6sc03039d

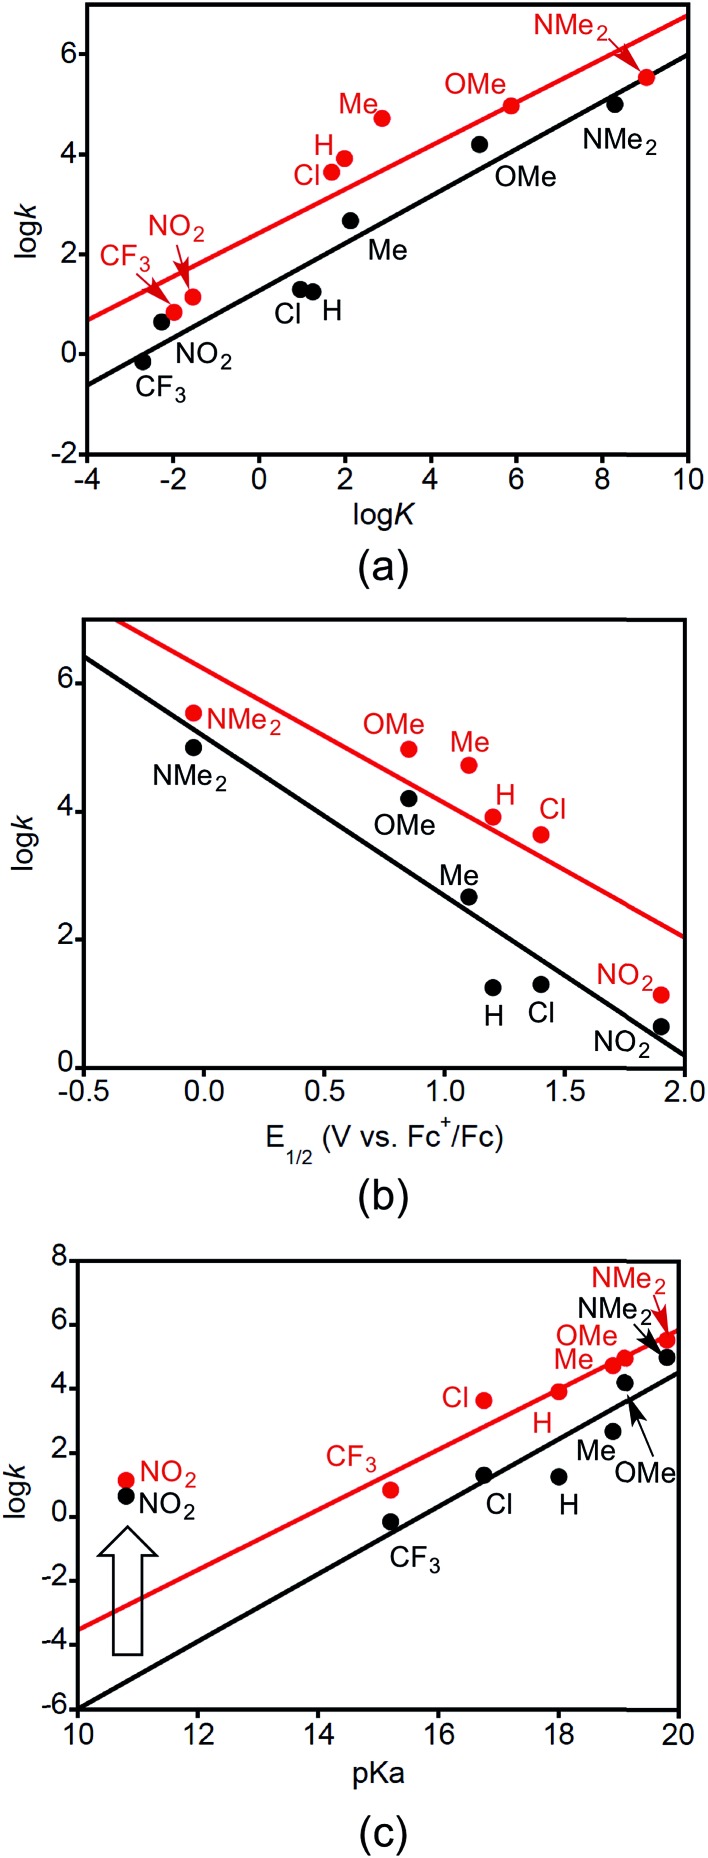
Fig. 4. (a) Plots of log k DMSO vs. log K CPET for reactions of 2a (black) and 2b (red) with phenols XArOH (X labeled). Linear fits have slopes of 0.47 (R 2 = 0.94) and 0.44 (R 2 = 0.84), respectively. (b) Plots of log k DMSO vs. E 1/2(XArOH+˙/XArOH) (X indicated) for their reactions with 2a (black) and 2b (red). The point for CF3ArOH is not included as the corresponding E 1/2 is not known. Linear fits have slopes of –2.5 (R 2 = 0.84) and –2.1 (R 2 = 0.76), respectively. (c) Plots of log k DMSO vs. pK a of the phenols XArOH (X indicated) for their reactions with 2a (black) and 2b (red). Linear fits do not include the data points for X = NO2 and have slopes of 1.1 (R 2 = 0.85) and 0.94 (R 2 = 0.93), respectively. The wide arrow indicates the X = NO2 outliers.

Fig. 4