. 2016 Oct 21;8(2):1474–1481. doi: 10.1039/c6sc04381j

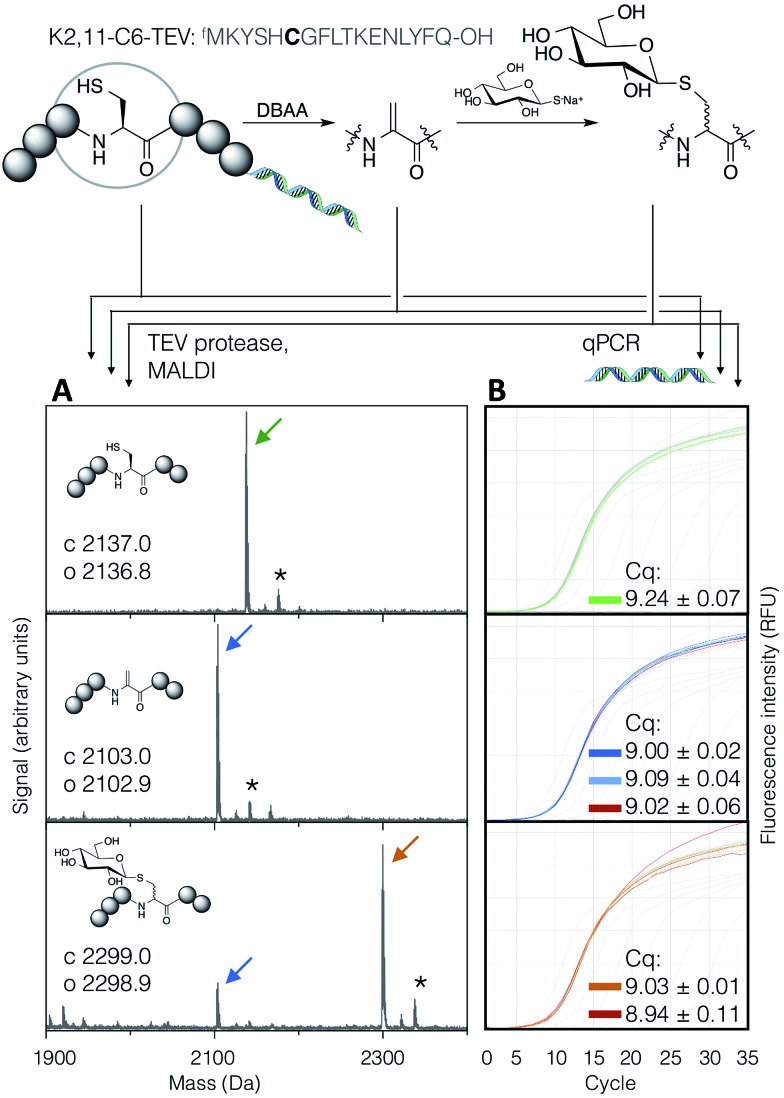
Fig. 5. Compatibility of the DBAA-mediated elimination and thiol conjugate addition reactions with an mRNA displayed test peptide (sequence shown at top, with site of modification emphasised in bold). On the left are MALDI-TOF-MS spectra for the peptides at each stage of modification, following cleavage off the mRNA by TEV protease, while on the right are qPCR traces for amplification of the cDNA from the same step. Cq values are averages of triplicate measurements ± standard error. Traces and peak markers are colour-coded by product as in Fig. 2, with the addition of green for the unmodified translation product, red for solvent-only negative controls in the qPCR amplification plots, and dark blue for a higher concentration of DBAA (*: potassium adduct).

Fig. 5