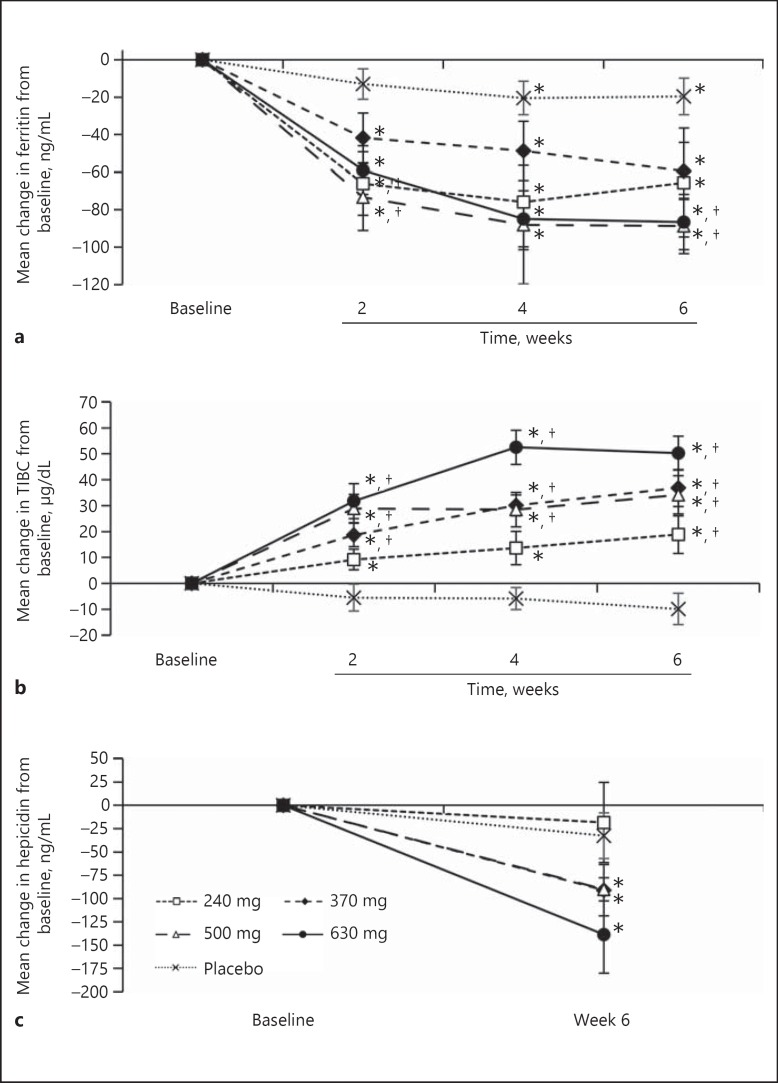
Fig. 3.
Observed mean ferritin concentration and total iron binding capacity (TIBC) over the trial period during administration of vadadustat or placebo (modified intent to treat population). Data are expressed as the mean ± SEM at each time point. a Mean change in ferritin concentration (±SEM) compared to baseline. b Mean change in TIBC compared to baseline. c Mean change in hepcidin concentration compared to baseline. * p < 0.05 for comparisons with baseline. † p < 0.05 for comparisons with placebo.

