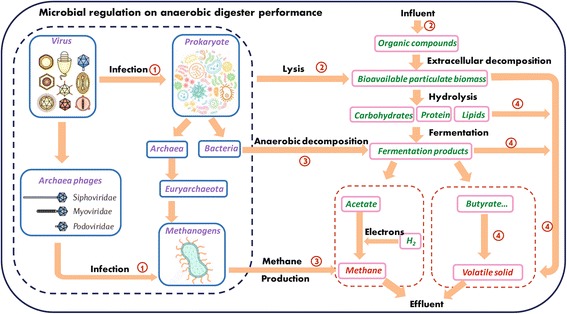
Fig. 3.

The biochemical pathway analysis to link phage and microbial communities to process performance of anaerobic digesters. Microbial communities are represented in purple. Intermediate metabolites are represented in green. Methane and volatile solid, which are process performance indices, are represented in red. Pathways are shown as arrows
